
AvalAI Performance
Use this page as a practical guide to prompt-cache efficiency, regional latency, throughput, and production measurement. Results are grouped by performance aspect and ordered newest first. Every benchmark is a point-in-time observation, not a service-wide guarantee.
Reports for 2026-08-14
Cache results across both OpenAI text endpoints
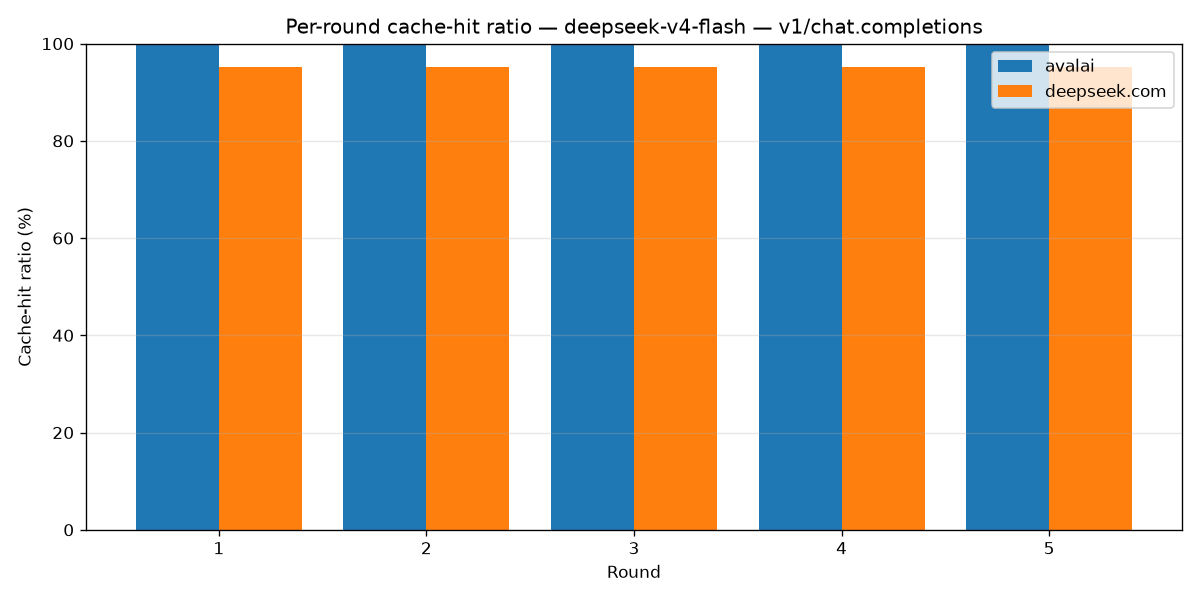
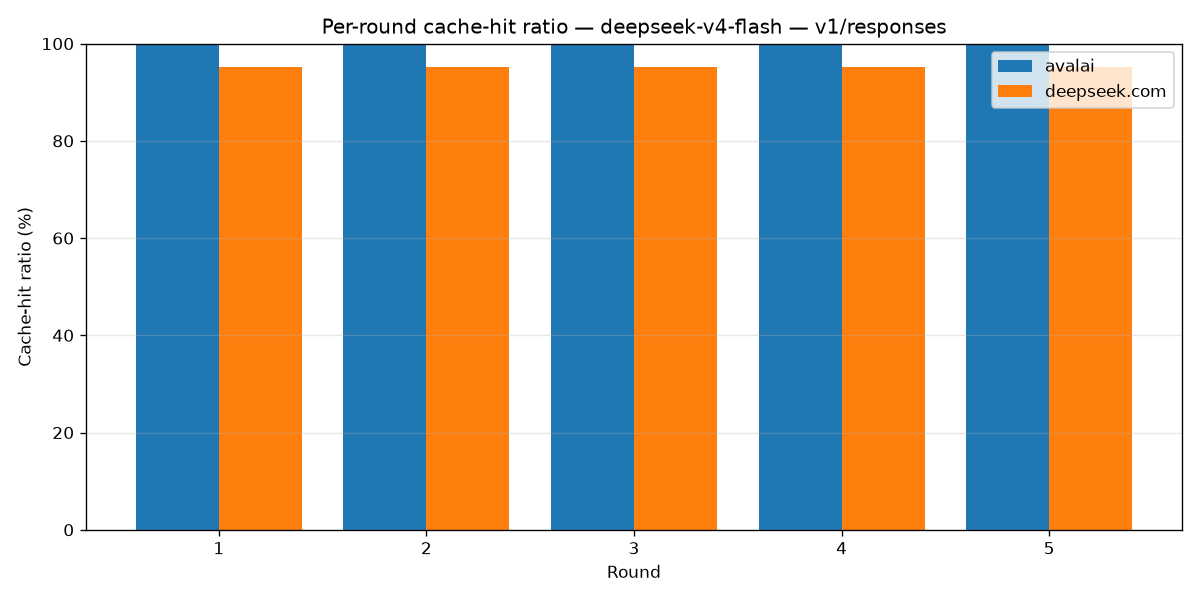
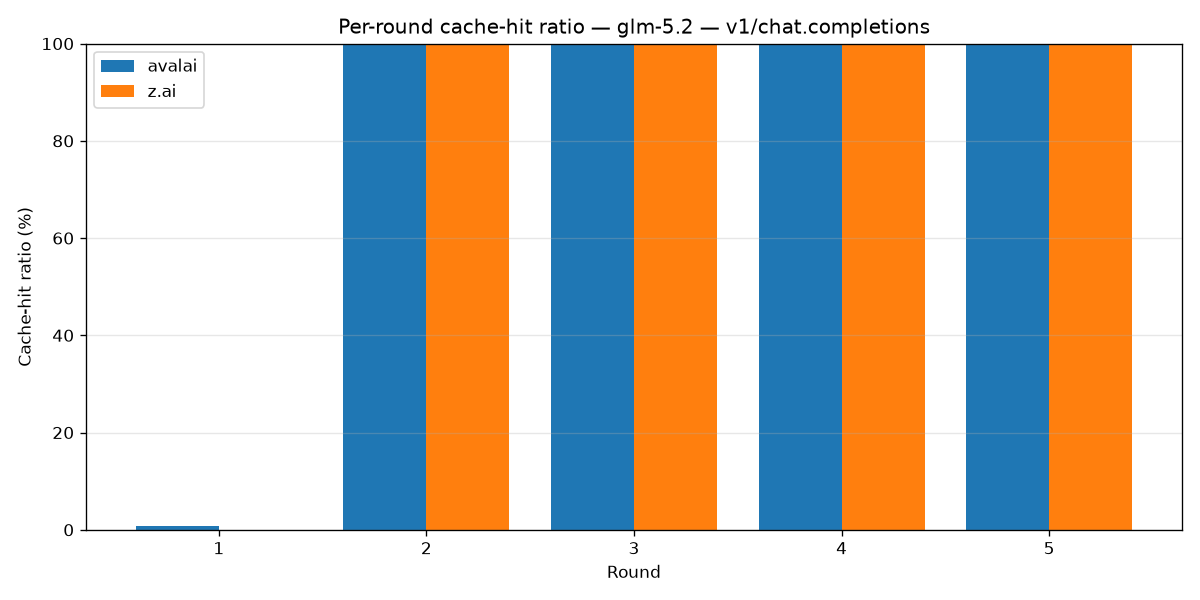
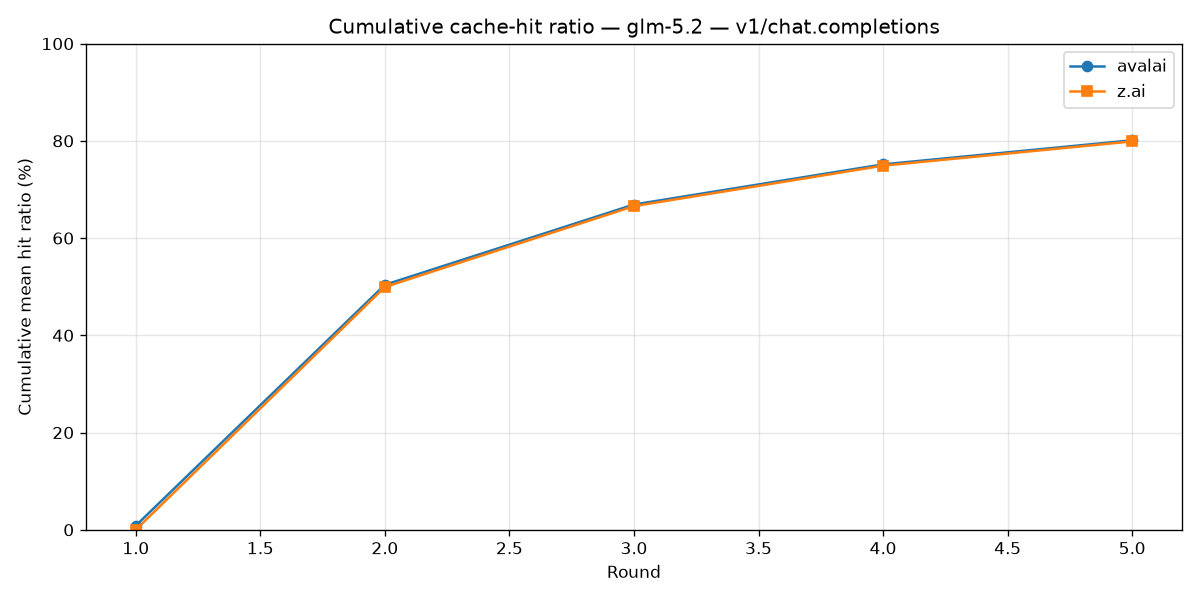
The corrected benchmark sends the same realistic legal-document request through AvalAI and each model's official provider using both v1/chat/completions and v1/responses. Round 1 primes each service, the runner waits 15 seconds, and rounds 2–5 measure warm-cache behavior. A hit is counted only when the API reports cached input tokens—primarily through usage.prompt_tokens_details.cached_tokens / usage.prompt_tokens—never from request order, timing, or an assumed stable prefix.
These are point-in-time observations from five sequential paired rounds per API for deepseek-v4-flash, glm-5.2, and kimi-k3. They show the behavior observed in this run, not a service-level guarantee.
deepseek-v4-flash: AvalAI and DeepSeek
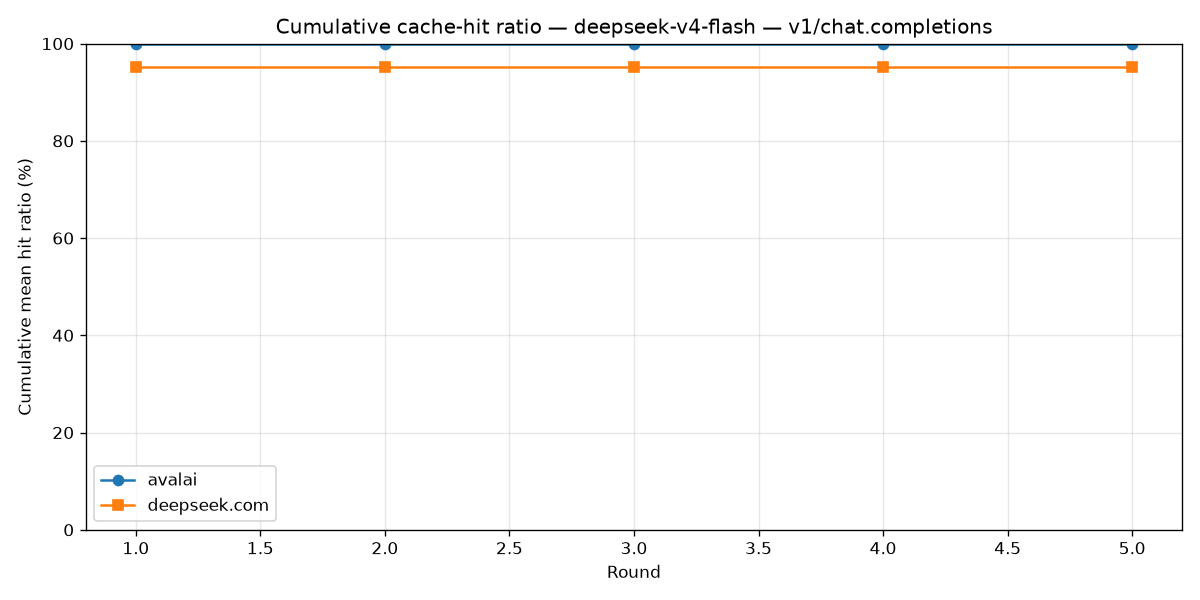
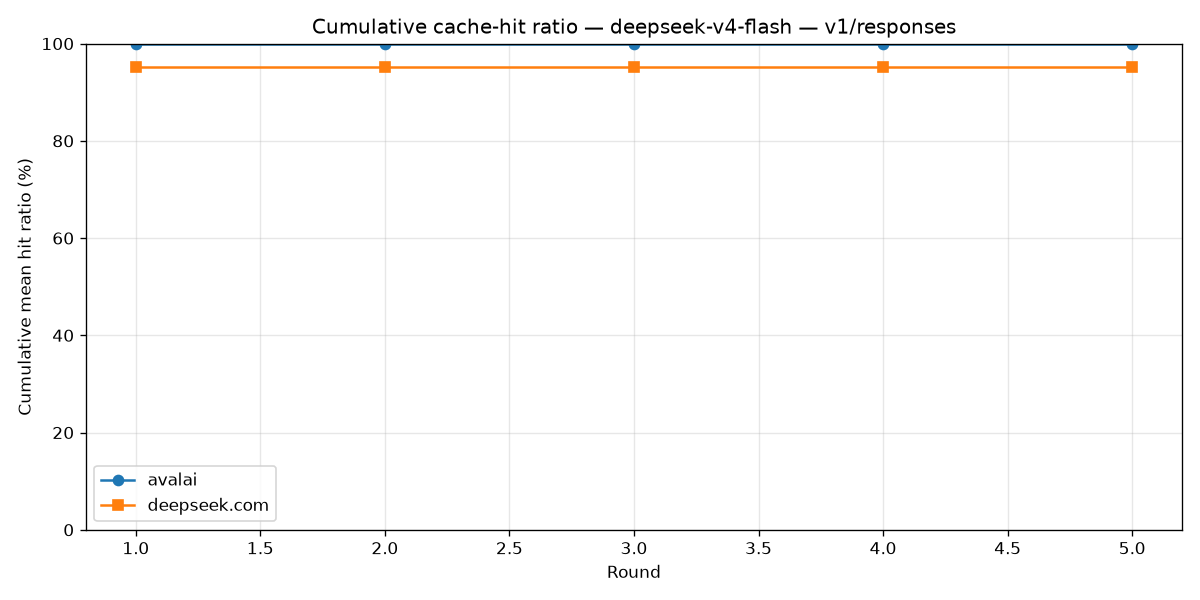
Both APIs completed 5/5 calls on both services. AvalAI reported a 99.9% cache-hit ratio in every round (1,400/1,401 tokens), while DeepSeek reported 95.1% (1,408/1,480), giving AvalAI a +4.8 percentage-point warm delta on each API.
| Service | API | Warm hit | Mean latency | Success |
|---|---|---|---|---|
| AvalAI | v1/chat/completions | 99.9% | 1.704s | 5/5 |
| DeepSeek | v1/chat/completions | 95.1% | 6.201s | 5/5 |
| AvalAI | v1/responses | 99.9% | 18.282s | 5/5 |
| DeepSeek | v1/responses | 95.1% | 6.444s | 5/5 |
glm-5.2: AvalAI and Z.AI
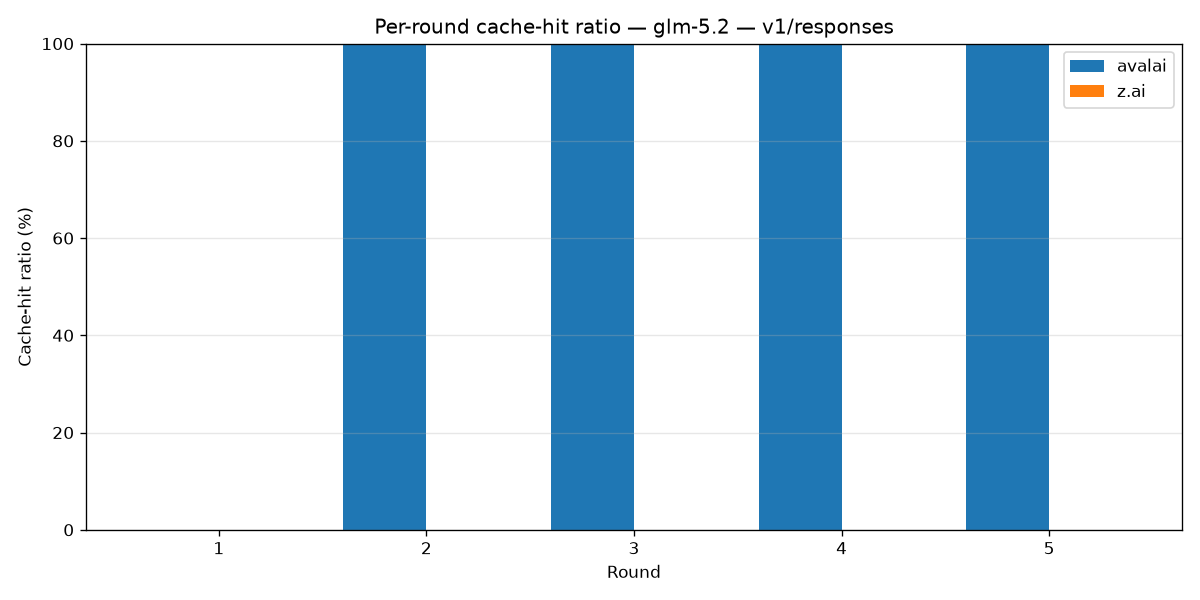
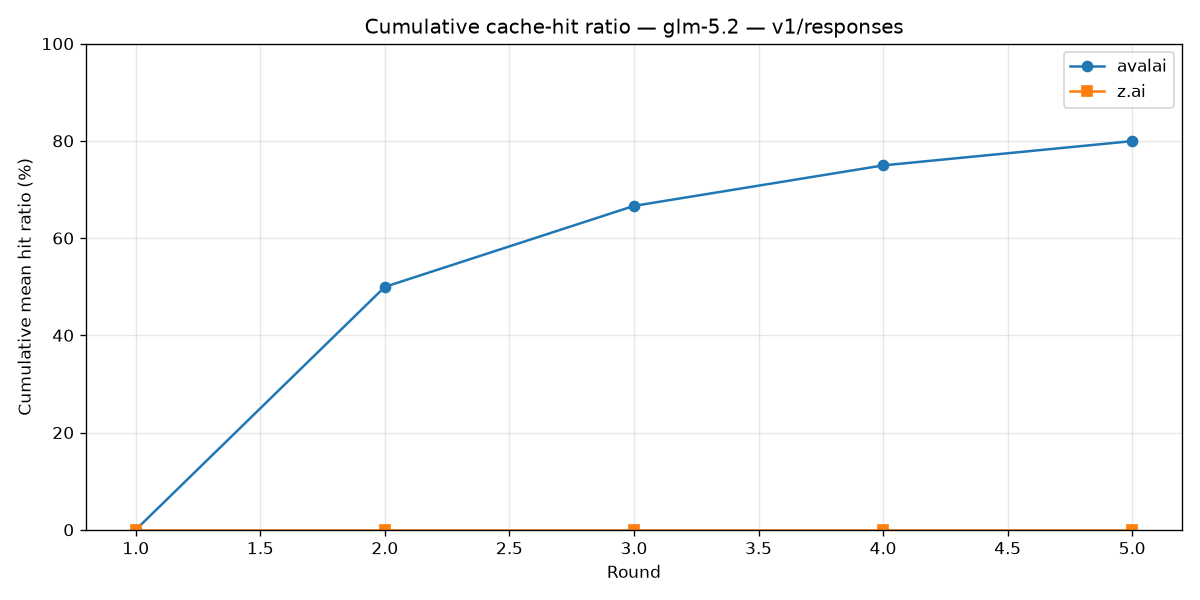
On v1/chat/completions, both services completed 5/5 calls and reached 99.9% warm cache hits. AvalAI reported 1,409/1,410 cached tokens in rounds 2–5; Z.AI reported 1,408/1,410. On v1/responses, AvalAI completed 5/5 calls and reached 99.9% after priming. Z.AI returned 404 Not Found for all five calls because the tested public base URL does not expose that endpoint; those failures are availability results, not successful requests with a 0% cache-hit ratio.
| Service | API | Warm hit | Mean latency | Success |
|---|---|---|---|---|
| AvalAI | v1/chat/completions | 99.9% | 20.394s | 5/5 |
| Z.AI | v1/chat/completions | 99.9% | 4.971s | 5/5 |
| AvalAI | v1/responses | 99.9% | 2.830s | 5/5 |
| Z.AI | v1/responses | Unavailable | — | 0/5 |
kimi-k3: AvalAI and Moonshot AI
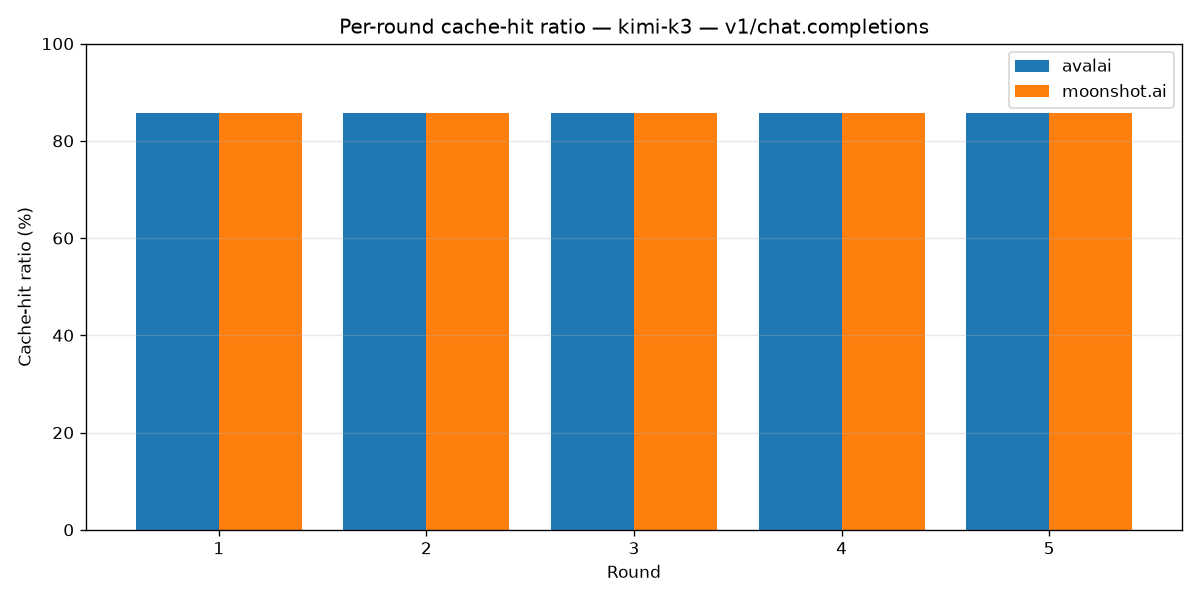
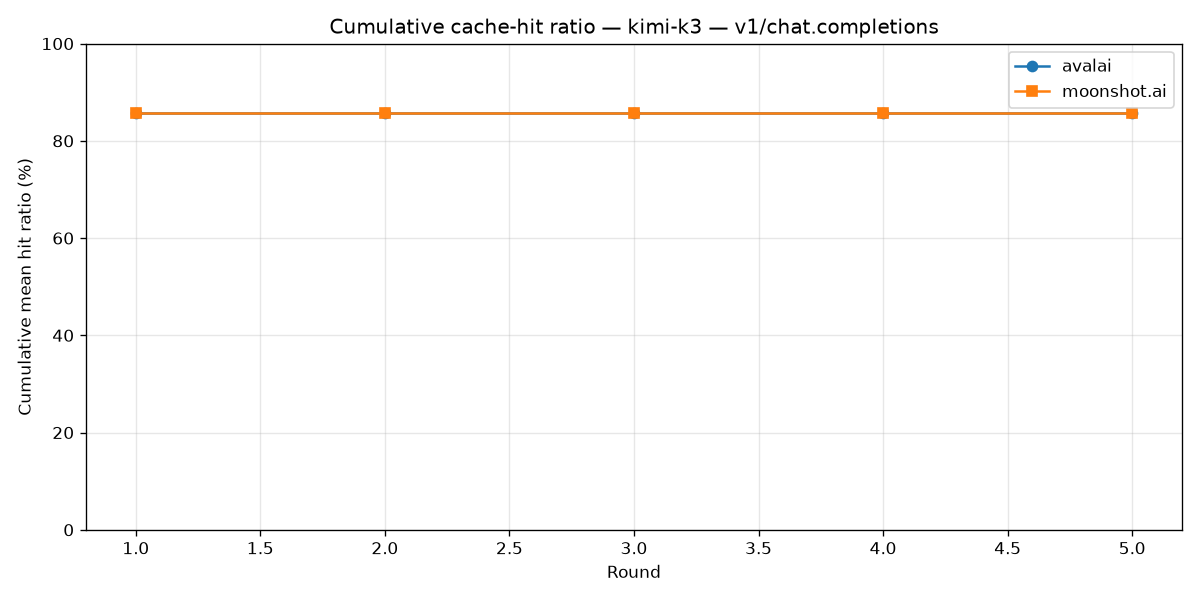
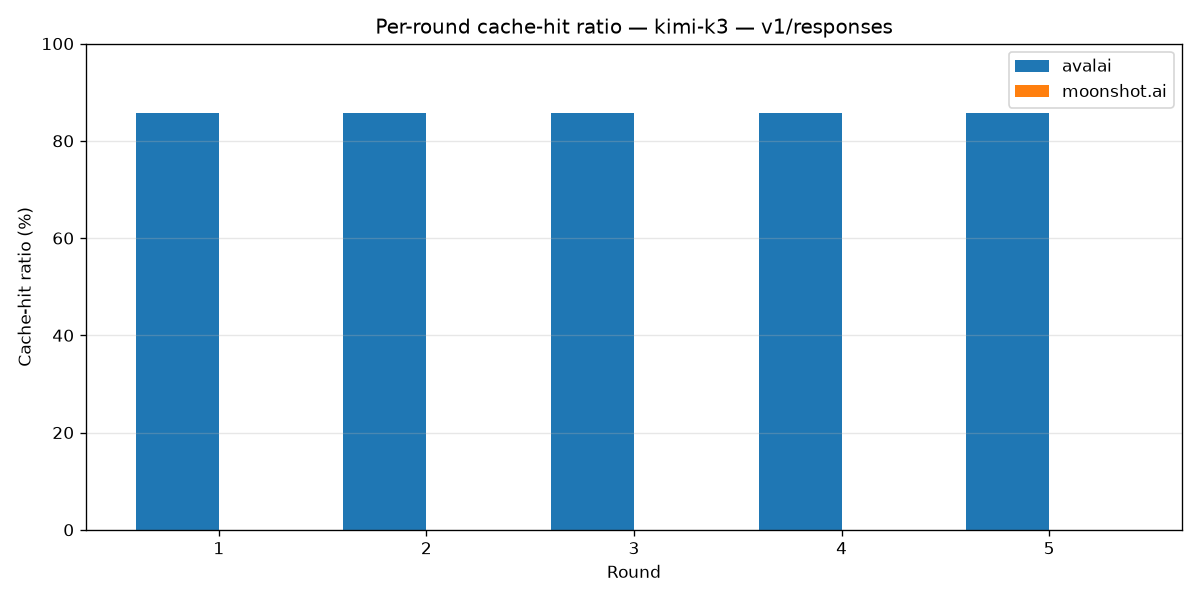
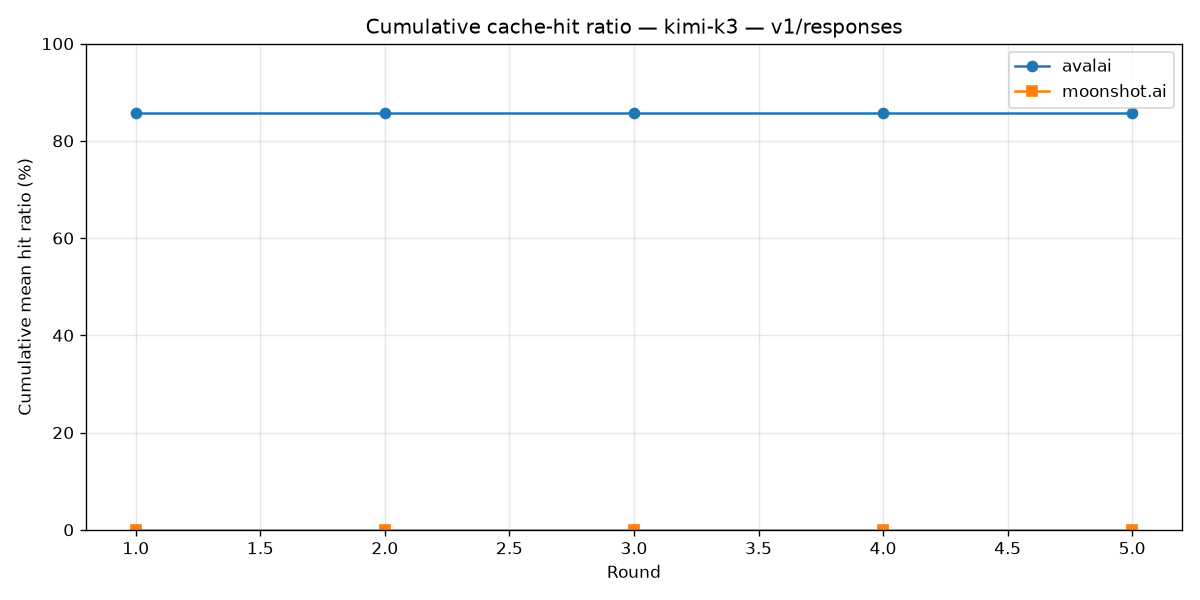
Both services completed 5/5 Chat Completions calls and reported 85.8% cache hits (1,280/1,492 tokens) in every round. AvalAI also completed 5/5 Responses calls at 85.8%. Moonshot's tested public API did not accept v1/responses: four calls returned a permission-denied response and one encountered a connection error. AvalAI still accepted Responses requests for this model by translating them through its internal routing layer to the compatible upstream flow.
| Service | API | Warm hit | Mean latency | Success |
|---|---|---|---|---|
| AvalAI | v1/chat/completions | 85.8% | 4.187s | 5/5 |
| Moonshot AI | v1/chat/completions | 85.8% | 7.819s | 5/5 |
| AvalAI | v1/responses | 85.8% | 4.401s | 5/5 |
| Moonshot AI | v1/responses | Unavailable | — | 0/5 |
Methodology and reproduction
The runner sends calls sequentially—AvalAI, then the official provider—and uses a service-local previous_response_id chain for Responses rounds. The generated JSON artifact retains the complete provider-reported usage object for audit, but the documentation intentionally does not publish local artifact paths or credentials.
python tests/benchmarks/test_cache_hit_ratio.py \
  --model deepseek-v4-flash --rounds 5 --prefix-tokens 2000 \
  --official-provider deepseek

python tests/benchmarks/test_cache_hit_ratio.py \
  --model glm-5.2 --rounds 5 --prefix-tokens 2000 \
  --official-provider zai

python tests/benchmarks/test_cache_hit_ratio.py \
  --model kimi-k3 --rounds 5 --prefix-tokens 2000 \
--official-provider moonshot.aiFull benchmark source
The complete corrected script supports both APIs, service-local Responses chains, OpenAI-compatible and Anthropic usage shapes, official-provider inference and aliases, stream-stall guards, JSON artifacts, and endpoint-specific charts. API keys are read from flags or standard environment variables and are never written to artifacts.
Show the full benchmark script
"""Prompt-cache hit-ratio comparison by service and OpenAI API endpoint.
This integration benchmark measures **prompt-caching effectiveness** for a
single model by driving the *same* caching experiment against two services and
both OpenAI text-generation endpoints:
* **avalai** — ``https://api.avalai.ir/v1`` (OpenAI-compatible proxy)
* **official** — the model's upstream provider (e.g. ``deepseek.com`` for
``deepseek-v4-flash``, ``openai`` for ``gpt-*``, ``claude.ai`` for
``claude-*``, ...).
* **v1/chat/completions** — repeated realistic sample requests.
* **v1/responses** — one response chain per service; rounds 2..N send the prior
response's id as ``previous_response_id`` to exercise session affinity.
Supported official providers: ``openai``, ``claude.ai`` (anthropic),
``deepseek``, ``z.ai``, ``dashscope`` (Alibaba/Qwen), ``moonshot.ai``,
``gemini``, ``xai``.
How prompt caching is measured
------------------------------
The benchmark repeatedly sends the same realistic, sufficiently-large sample
conversation. It does **not** infer a hit from prompt text, timing, seed reuse,
or request order. A call is a cache hit only when the API response's ``usage``
dict reports cached input tokens.
For every service/endpoint pair, the complete reported ``usage`` dict is saved
and the ratio is calculated strictly as
``usage.prompt_tokens_details.cached_tokens / usage.prompt_tokens`` (or the
provider's documented equivalent). The table, summary, JSON artifact, and
charts under ``tests/benchmarks/results/`` all use those reported values.
Cache-usage field shapes differ per provider (all normalised by the
extractors below):
* OpenAI / DeepSeek / z.ai / DashScope / Moonshot / xAI (OpenAI-compatible) ->
``usage.prompt_tokens_details.cached_tokens`` (DeepSeek additionally exposes
``prompt_cache_hit_tokens`` / ``prompt_cache_miss_tokens``).
* Anthropic (claude.ai) -> top-level ``usage.cache_read_input_tokens`` +
``usage.cache_creation_input_tokens`` (requires an explicit
``cache_control: {"type": "ephemeral"}`` breakpoint on a content block).
* Gemini -> ``usageMetadata.cachedContentTokenCount``.
Usage
-----
python -m tests.benchmarks.test_cache_hit_ratio \\
--model deepseek-v4-flash \\
--rounds 5 --prefix-tokens 4000
Provide keys via flags (``--avalai-api-key``, ``--deepseek-api-key``, ...) or
the standard environment variables (``AVALAI_API_KEY``, ``DEEPSEEK_API_KEY``,
...). Missing keys fail fast *before* any AvalAI request is issued.
"""
from __future__ import annotations
import argparse
import asyncio
import contextlib
import json
import os
import statistics
import time
from dataclasses import asdict, dataclass, field
from datetime import datetime, timezone
from pathlib import Path
from typing import Any, AsyncIterator, Callable, Mapping, Sequence
RESULTS_DIR = Path(__file__).resolve().parent / "results"
# The sample must clear the provider's activation floor. ~2048 tokens is a safe
# default across the supported providers.
DEFAULT_MIN_CACHE_TOKENS = 2048
# ---------------------------------------------------------------------------
# Cache-usage extractors
#
# Each extractor takes a provider ``usage`` object (SDK model or dict) and
# returns a normalised ``(prompt_tokens, cached_tokens, cache_creation_tokens)``
# tuple. They tolerate both attribute access (SDK models) and mapping access
# (raw dicts / LiteLLM envelopes).
# ---------------------------------------------------------------------------
def _get(obj: Any, key: str, default: Any = None) -> Any:
"""Read ``key`` from ``obj`` whether it is a mapping or an object."""
if obj is None:
return default
if isinstance(obj, Mapping):
return obj.get(key, default)
return getattr(obj, key, default)
def _as_int(value: Any) -> int:
try:
if value is None:
return 0
return int(value)
except (TypeError, ValueError):
return 0
def usage_to_dict(usage: Any) -> dict[str, Any]:
"""Return the raw provider ``usage`` object as a plain, JSON-safe dict.
The cache-hit ratio is judged SOLELY from this reported ``usage`` dict —
never from any prefix/seed assumption. This helper normalises the many
shapes ``usage`` can arrive in (OpenAI SDK model, Anthropic SDK model,
LiteLLM envelope, or a raw dict) into a plain dict so the exact numbers
the API returned are recorded verbatim in the JSON artifact and are what
every ratio is computed from.
"""
if usage is None:
return {}
if isinstance(usage, Mapping):
return {str(k): _jsonable(v) for k, v in usage.items()}
# Pydantic v2 SDK models.
for dumper in ("model_dump", "dict"):
fn = getattr(usage, dumper, None)
if callable(fn):
try:
dumped = fn()
if isinstance(dumped, Mapping):
return {str(k): _jsonable(v) for k, v in dumped.items()}
except Exception: # noqa: BLE001 - fall through to attr scrape
pass
# Last resort: scrape public attributes off an arbitrary object.
out: dict[str, Any] = {}
for name in dir(usage):
if name.startswith("_"):
continue
try:
val = getattr(usage, name)
except Exception: # noqa: BLE001
continue
if callable(val):
continue
out[name] = _jsonable(val)
return out
def _jsonable(value: Any) -> Any:
"""Coerce ``value`` into a JSON-serialisable structure."""
if value is None or isinstance(value, (bool, int, float, str)):
return value
if isinstance(value, Mapping):
return {str(k): _jsonable(v) for k, v in value.items()}
if isinstance(value, (list, tuple)):
return [_jsonable(v) for v in value]
for dumper in ("model_dump", "dict"):
fn = getattr(value, dumper, None)
if callable(fn):
try:
dumped = fn()
if isinstance(dumped, Mapping):
return {str(k): _jsonable(v) for k, v in dumped.items()}
except Exception: # noqa: BLE001
pass
# Nested SDK sub-model (e.g. prompt_tokens_details) — scrape attributes.
nested: dict[str, Any] = {}
for name in dir(value):
if name.startswith("_"):
continue
try:
sub = getattr(value, name)
except Exception: # noqa: BLE001
continue
if callable(sub):
continue
nested[name] = _jsonable(sub)
return nested or str(value)
def extract_openai_style(usage: Any) -> tuple[int, int, int]:
"""OpenAI-style Chat Completions or Responses API usage.
The ratio is derived ONLY from the provider-reported ``usage`` dict.
Chat Completions uses ``prompt_tokens`` / ``prompt_tokens_details`` while
Responses uses ``input_tokens`` / ``input_tokens_details``. DeepSeek also
reports ``prompt_cache_hit_tokens``, which is retained as a fallback.
"""
prompt_tokens = _as_int(_get(usage, "prompt_tokens"))
details = _get(usage, "prompt_tokens_details")
if prompt_tokens == 0:
prompt_tokens = _as_int(_get(usage, "input_tokens"))
details = _get(usage, "input_tokens_details")
cached = _as_int(_get(details, "cached_tokens"))
if cached == 0:
# DeepSeek-native fields (present on both avalai passthrough and
# api.deepseek.com direct responses).
cached = _as_int(_get(usage, "prompt_cache_hit_tokens"))
cache_creation = _as_int(_get(details, "cache_creation_tokens"))
return prompt_tokens, cached, cache_creation
def extract_anthropic_style(usage: Any) -> tuple[int, int, int]:
"""Extract native Anthropic or AvalAI-normalised Claude usage.
Native Anthropic reports ``input_tokens``, ``cache_read_input_tokens`` and
``cache_creation_input_tokens`` at the top level. AvalAI returns Claude
usage in the OpenAI-compatible ``prompt_tokens`` / ``prompt_tokens_details``
shape, so fall back to that representation when native fields are absent.
"""
input_tokens = _as_int(_get(usage, "input_tokens"))
cache_read = _as_int(_get(usage, "cache_read_input_tokens"))
cache_creation = _as_int(_get(usage, "cache_creation_input_tokens"))
if input_tokens or cache_read or cache_creation:
prompt_tokens = input_tokens + cache_read + cache_creation
return prompt_tokens, cache_read, cache_creation
return extract_openai_style(usage)
def extract_gemini_style(usage: Any) -> tuple[int, int, int]:
"""Gemini ``usageMetadata`` -> ``cachedContentTokenCount``.
When routed through the OpenAI-compatible endpoint the counts land in the
OpenAI shape, so we try that first and fall back to the native camelCase
field names.
"""
prompt_tokens = _as_int(_get(usage, "prompt_tokens"))
if prompt_tokens == 0:
prompt_tokens = _as_int(_get(usage, "promptTokenCount"))
details = _get(usage, "prompt_tokens_details")
cached = _as_int(_get(details, "cached_tokens"))
if cached == 0:
cached = _as_int(_get(usage, "cachedContentTokenCount"))
if cached == 0:
cached = _as_int(_get(usage, "cached_content_token_count"))
return prompt_tokens, cached, 0
# ---------------------------------------------------------------------------
# Provider registry
# ---------------------------------------------------------------------------
@dataclass(frozen=True)
class ProviderSpec:
"""Static configuration for one official provider."""
key: str # canonical registry key, e.g. "deepseek"
label: str # human label, e.g. "deepseek.com"
base_url: str # official OpenAI-compatible base URL
env_var: str # env var holding the official key
cli_flag: str # argparse flag, e.g. "--deepseek-api-key"
dest: str # argparse dest, e.g. "deepseek_api_key"
transport: str # "openai" | "anthropic"
extractor: Callable[[Any], tuple[int, int, int]]
min_cache_tokens: int = DEFAULT_MIN_CACHE_TOKENS
# Model-name prefixes that map to this provider (lower-cased).
model_prefixes: tuple[str, ...] = ()
def _spec(key: str, label: str, base_url: str, env_var: str, transport: str,
extractor: Callable[[Any], tuple[int, int, int]],
model_prefixes: tuple[str, ...],
min_cache_tokens: int = DEFAULT_MIN_CACHE_TOKENS) -> ProviderSpec:
return ProviderSpec(
key=key,
label=label,
base_url=base_url,
env_var=env_var,
cli_flag=f"--{key.replace('_', '-')}-api-key",
dest=f"{key}_api_key",
transport=transport,
extractor=extractor,
min_cache_tokens=min_cache_tokens,
model_prefixes=model_prefixes,
)
PROVIDER_REGISTRY: dict[str, ProviderSpec] = {
"openai": _spec(
"openai", "openai", "https://api.openai.com/v1",
"OPENAI_API_KEY", "openai", extract_openai_style,
("gpt-", "o1", "o3", "o4", "chatgpt-"),
min_cache_tokens=1024, # OpenAI auto-caches prompts > 1024 tokens.
),
"anthropic": _spec(
"anthropic", "claude.ai", "https://api.anthropic.com",
"ANTHROPIC_API_KEY", "anthropic", extract_anthropic_style,
("claude-", "claude."),
),
"deepseek": _spec(
"deepseek", "deepseek.com", "https://api.deepseek.com",
"DEEPSEEK_API_KEY", "openai", extract_openai_style,
("deepseek-", "deepseek."),
),
"zai": _spec(
"zai", "z.ai", "https://api.z.ai/api/paas/v4",
"ZAI_API_KEY", "openai", extract_openai_style,
("glm-", "glm."),
),
"dashscope": _spec(
"dashscope", "dashscope",
"https://dashscope-intl.aliyuncs.com/compatible-mode/v1",
"DASHSCOPE_API_KEY", "openai", extract_openai_style,
("qwen-", "qwen.", "qwen2", "qwen3", "qwq-", "qwq.",
"wan-", "wan.", "alibaba-", "alibaba."),
),
"moonshot": _spec(
"moonshot", "moonshot.ai", "https://api.moonshot.ai/v1",
"MOONSHOT_API_KEY", "openai", extract_openai_style,
("kimi-", "kimi.", "moonshot-", "moonshot-v"),
),
"gemini": _spec(
"gemini", "gemini",
"https://generativelanguage.googleapis.com/v1beta/openai",
"GEMINI_API_KEY", "openai", extract_gemini_style,
("gemini-", "gemini."),
),
"xai": _spec(
"xai", "xai", "https://api.x.ai/v1",
"XAI_API_KEY", "openai", extract_openai_style,
("grok-", "grok."),
),
}
# Friendly aliases accepted for --official-provider.
PROVIDER_ALIASES: dict[str, str] = {
"claude.ai": "anthropic",
"claude": "anthropic",
"anthropic": "anthropic",
"z.ai": "zai",
"zai": "zai",
"dashscope": "dashscope",
"alibaba": "dashscope",
"aliyun": "dashscope",
"qwen": "dashscope",
"moonshot.ai": "moonshot",
"moonshot": "moonshot",
"kimi": "moonshot",
"deepseek.com": "deepseek",
"deepseek": "deepseek",
"openai": "openai",
"gemini": "gemini",
"google": "gemini",
"xai": "xai",
"x.ai": "xai",
"grok": "xai",
}
AVALAI_DEFAULT_BASE_URL = "https://api.avalai.ir/v1"
AVALAI_ENV_VAR = "AVALAI_API_KEY"
def resolve_provider(model: str, override: str | None) -> ProviderSpec:
"""Resolve the official provider for ``model``.
An explicit ``--official-provider`` override wins; otherwise the provider
is inferred from the model-name prefix.
"""
if override:
canonical = PROVIDER_ALIASES.get(override.strip().lower())
if canonical is None:
raise ValueError(
f"Unknown official provider '{override}'. Supported: "
f"{', '.join(sorted(set(PROVIDER_ALIASES)))}"
)
return PROVIDER_REGISTRY[canonical]
lowered = model.strip().lower()
for spec in PROVIDER_REGISTRY.values():
for prefix in spec.model_prefixes:
if lowered.startswith(prefix):
return spec
raise ValueError(
f"Could not infer an official provider from model '{model}'. "
f"Pass --official-provider explicitly (one of: "
f"{', '.join(sorted(PROVIDER_REGISTRY))})."
)
# ---------------------------------------------------------------------------
# Metrics dataclasses
# ---------------------------------------------------------------------------
@dataclass
class RoundMetrics:
round_id: int
endpoint: str # "avalai" | official label
api: str # "chat.completions" | "responses"
prompt_tokens: int
cached_tokens: int
cache_creation_tokens: int
cache_hit_ratio: float
latency: float
ttft: float
output_tokens: int
# Complete usage object reported by the API. The normalized fields above
# are derived only from this dict; it is persisted for independent audit.
usage: dict[str, Any] = field(default_factory=dict)
error: str | None = None
@dataclass
class EndpointSummary:
endpoint: str
api: str
rounds: int
successful: int
mean_hit_ratio: float
median_hit_ratio: float
p90_hit_ratio: float
first_hit_round: int | None
first_hit_latency: float | None
mean_latency: float
mean_ttft: float
warm_mean_hit_ratio: float # mean over rounds >= 2 (warm cache)
per_round: list[RoundMetrics] = field(default_factory=list)
# ---------------------------------------------------------------------------
# Sample request construction
# ---------------------------------------------------------------------------
# ~4 characters per token sizes the realistic legal-document sample. It is not
# used to determine whether caching happened; only response.usage is.
_CHARS_PER_TOKEN = 4
_LEGAL_TEXT = (
"Here is the full text of a complex legal agreement. The agreement defines "
"the parties, term, payment obligations, confidentiality duties, warranties, "
"liability limits, termination rights, dispute resolution, governing law, "
"data protection requirements, and amendment procedures. "
)
def build_sample_document(target_tokens: int, min_tokens: int) -> str:
"""Build the realistic repeated legal-document sample used by each call."""
target_chars = max(target_tokens, min_tokens) * _CHARS_PER_TOKEN
introduction = (
"You are an AI assistant tasked with analyzing legal documents. "
"Read the following agreement and answer the user's question.\n\n"
)
repetitions = max(1, (target_chars - len(introduction)) // len(_LEGAL_TEXT) + 1)
return introduction + (_LEGAL_TEXT * repetitions)
def build_user_question(_round_id: int) -> str:
"""Return the same realistic question on every call."""
return "What are the key terms and conditions in this agreement?"
# ---------------------------------------------------------------------------
# Endpoint clients
#
# ``EndpointClient`` abstracts the two transports:
# * "openai" -> openai.AsyncOpenAI (avalai + openai-compatible officials)
# * "anthropic" -> anthropic.AsyncAnthropic (claude.ai)
# Each returns a normalised ``(prompt_tokens, cached, cache_creation,
# output_tokens, ttft, latency)`` tuple for one round.
# ---------------------------------------------------------------------------
@dataclass
class EndpointConfig:
name: str # "avalai" or the official provider label
transport: str # "openai" | "anthropic"
base_url: str
api_key: str
model: str
extractor: Callable[[Any], tuple[int, int, int]]
max_tokens: int = 64
# Wall-clock ceiling for a whole round (connect + full stream). A stalled
# proxy/upstream that keeps the socket open but stops emitting bytes must
# not hang the run forever, so this bounds the total request duration.
request_timeout: float = 120.0
# Idle guard: max seconds allowed *between* two consecutive stream chunks.
# Trips well before ``request_timeout`` when a stream stalls mid-flight
# (e.g. AvalAI stops sending the final usage/priced chunk).
stream_idle_timeout: float = 60.0
class StreamStalled(TimeoutError):
"""Raised when a stream exceeds its idle-gap or wall-clock budget.
Subclasses ``TimeoutError`` so callers that only distinguish "timed out"
keep working, while the message pinpoints *which* guard tripped.
"""
async def _iter_with_idle_guard(
stream: AsyncIterator[Any],
*,
idle_timeout: float,
deadline: float,
) -> AsyncIterator[Any]:
"""Yield from ``stream`` while enforcing an idle-gap + wall-clock guard.
A proxy that keeps the socket open but stops emitting bytes (the classic
"avalai stucks" mid-stream stall) would otherwise block ``async for``
forever, since the SDK stream iterators have no read-idle timeout. This
wraps each ``__anext__`` in ``asyncio.wait_for`` bounded by the smaller of
the remaining wall-clock budget and ``idle_timeout``, raising
``StreamStalled`` instead of hanging.
"""
iterator = stream.__aiter__()
while True:
remaining = deadline - time.perf_counter()
if remaining <= 0:
raise StreamStalled(
"stream exceeded wall-clock budget "
"(no completion within the request timeout)"
)
try:
chunk = await asyncio.wait_for(
iterator.__anext__(),
timeout=min(idle_timeout, remaining),
)
except StopAsyncIteration:
return
except (asyncio.TimeoutError, TimeoutError) as exc:
raise StreamStalled(
f"stream stalled: no chunk received within "
f"{idle_timeout:.1f}s idle window"
) from exc
yield chunk
async def _run_openai_round(cfg: EndpointConfig, document: str,
question: str) -> tuple[int, int, int, int,
float, float, dict[str, Any]]:
"""One streaming round via the OpenAI-compatible transport."""
from openai import AsyncOpenAI
client = AsyncOpenAI(
base_url=cfg.base_url,
api_key=cfg.api_key,
timeout=cfg.request_timeout,
max_retries=0, # benchmark measures a single attempt per round
)
messages = [
{"role": "system", "content": document},
{"role": "user", "content": question},
]
start = time.perf_counter()
deadline = start + cfg.request_timeout
first_token_time: float | None = None
output_tokens = 0
usage_obj: Any = None
try:
stream = await asyncio.wait_for(
client.chat.completions.create(
model=cfg.model,
messages=messages, # type: ignore[arg-type]
max_tokens=cfg.max_tokens,
temperature=1.0,
stream=True,
stream_options={"include_usage": True},
),
timeout=max(0.0, deadline - time.perf_counter()),
)
async for chunk in _iter_with_idle_guard(
stream,
idle_timeout=cfg.stream_idle_timeout,
deadline=deadline,
):
if first_token_time is None and getattr(chunk, "choices", None):
delta = chunk.choices[0].delta if chunk.choices else None
if delta is not None and getattr(delta, "content", None):
first_token_time = time.perf_counter()
if getattr(chunk, "usage", None) is not None:
usage_obj = chunk.usage
finally:
with contextlib.suppress(Exception):
await asyncio.wait_for(client.close(), timeout=5.0)
latency = time.perf_counter() - start
ttft = (first_token_time - start) if first_token_time else latency
usage = usage_to_dict(usage_obj)
prompt_tokens, cached, cache_creation = cfg.extractor(usage)
output_tokens = _as_int(_get(usage, "completion_tokens"))
if output_tokens == 0:
output_tokens = _as_int(_get(usage, "output_tokens"))
return prompt_tokens, cached, cache_creation, output_tokens, ttft, latency, usage
async def _run_responses_round(
cfg: EndpointConfig,
document: str,
question: str,
previous_response_id: str | None,
) -> tuple[int, int, int, int, float, float, dict[str, Any], str | None]:
"""One streaming ``v1/responses`` round with a service-local response chain."""
from openai import AsyncOpenAI
client = AsyncOpenAI(
base_url=cfg.base_url,
api_key=cfg.api_key,
timeout=cfg.request_timeout,
max_retries=0,
)
start = time.perf_counter()
deadline = start + cfg.request_timeout
first_token_time: float | None = None
final_response: Any = None
request_input = [
{"role": "system", "content": document},
{"role": "user", "content": question},
]
try:
stream = await asyncio.wait_for(
client.responses.create(
model=cfg.model,
input=request_input, # type: ignore[arg-type]
previous_response_id=previous_response_id,
max_output_tokens=cfg.max_tokens,
temperature=1.0,
stream=True,
store=True,
),
timeout=max(0.0, deadline - time.perf_counter()),
)
async for event in _iter_with_idle_guard(
stream,
idle_timeout=cfg.stream_idle_timeout,
deadline=deadline,
):
event_type = _get(event, "type", "")
if first_token_time is None and event_type == "response.output_text.delta":
if _get(event, "delta"):
first_token_time = time.perf_counter()
if event_type in {"response.completed", "response.incomplete"}:
final_response = _get(event, "response")
finally:
with contextlib.suppress(Exception):
await asyncio.wait_for(client.close(), timeout=5.0)
latency = time.perf_counter() - start
ttft = (first_token_time - start) if first_token_time else latency
usage = usage_to_dict(_get(final_response, "usage"))
prompt_tokens, cached, cache_creation = cfg.extractor(usage)
output_tokens = _as_int(_get(usage, "output_tokens"))
response_id = _get(final_response, "id")
if not response_id:
raise ValueError("v1/responses stream completed without a response id")
return (
prompt_tokens, cached, cache_creation, output_tokens, ttft, latency,
usage, str(response_id),
)
async def _run_anthropic_round(cfg: EndpointConfig, document: str,
question: str) -> tuple[int, int, int, int,
float, float,
dict[str, Any]]:
"""One streaming round via the Anthropic transport.
Anthropic requires an explicit ``cache_control: {"type": "ephemeral"}``
breakpoint on the large stable block; usage reports cache tokens at the
top level (handled by ``extract_anthropic_style``).
"""
from anthropic import AsyncAnthropic
client = AsyncAnthropic(
base_url=cfg.base_url,
api_key=cfg.api_key,
timeout=cfg.request_timeout,
max_retries=0, # benchmark measures a single attempt per round
)
system_blocks = [
{
"type": "text",
"text": document,
"cache_control": {"type": "ephemeral"},
}
]
messages = [{"role": "user", "content": question}]
start = time.perf_counter()
deadline = start + cfg.request_timeout
first_token_time: float | None = None
usage_obj: Any = None
try:
# Do not send ``temperature`` here: newer Claude models (including
# Claude Sonnet 5) reject the formerly-supported parameter as deprecated.
# Prompt-cache measurements do not depend on sampling configuration.
async with client.messages.stream(
model=cfg.model,
max_tokens=cfg.max_tokens,
system=system_blocks, # type: ignore[arg-type]
messages=messages, # type: ignore[arg-type]
) as stream:
async for event in _iter_with_idle_guard(
stream,
idle_timeout=cfg.stream_idle_timeout,
deadline=deadline,
):
etype = getattr(event, "type", "")
if first_token_time is None and etype == "content_block_delta":
first_token_time = time.perf_counter()
final_message = await asyncio.wait_for(
stream.get_final_message(),
timeout=max(0.0, deadline - time.perf_counter()),
)
usage_obj = getattr(final_message, "usage", None)
finally:
with contextlib.suppress(Exception):
await asyncio.wait_for(client.close(), timeout=5.0)
latency = time.perf_counter() - start
ttft = (first_token_time - start) if first_token_time else latency
usage = usage_to_dict(usage_obj)
prompt_tokens, cached, cache_creation = cfg.extractor(usage)
output_tokens = _as_int(_get(usage, "output_tokens"))
return prompt_tokens, cached, cache_creation, output_tokens, ttft, latency, usage
async def run_round(
cfg: EndpointConfig,
round_id: int,
document: str,
api: str = "chat.completions",
previous_response_id: str | None = None,
) -> tuple[RoundMetrics, str | None]:
"""Execute one API round and derive metrics only from reported usage."""
question = build_user_question(round_id)
next_response_id: str | None = None
try:
if api == "responses":
(prompt_tokens, cached, cache_creation, output_tokens, ttft, latency,
usage, next_response_id) = await _run_responses_round(
cfg, document, question, previous_response_id
)
elif cfg.transport == "anthropic":
(prompt_tokens, cached, cache_creation, output_tokens,
ttft, latency, usage) = await _run_anthropic_round(
cfg, document, question
)
else:
(prompt_tokens, cached, cache_creation, output_tokens,
ttft, latency, usage) = await _run_openai_round(
cfg, document, question
)
except Exception as exc: # noqa: BLE001 - benchmark records failures
return RoundMetrics(
round_id=round_id,
endpoint=cfg.name,
api=api,
prompt_tokens=0,
cached_tokens=0,
cache_creation_tokens=0,
cache_hit_ratio=0.0,
latency=0.0,
ttft=0.0,
output_tokens=0,
usage={},
error=f"{type(exc).__name__}: {exc}",
), previous_response_id
hit_ratio = (cached / prompt_tokens) if prompt_tokens > 0 else 0.0
return RoundMetrics(
round_id=round_id,
endpoint=cfg.name,
api=api,
prompt_tokens=prompt_tokens,
cached_tokens=cached,
cache_creation_tokens=cache_creation,
cache_hit_ratio=hit_ratio,
latency=latency,
ttft=ttft,
output_tokens=output_tokens,
usage=usage,
), next_response_id
async def run_interleaved(avalai_cfg: EndpointConfig,
official_cfg: EndpointConfig,
rounds: int, document: str, concurrency: int,
round_delay: float = 15.0,
api: str = "chat.completions",
) -> tuple[list[RoundMetrics], list[RoundMetrics]]:
"""Run one AvalAI call, then one official call, and repeat.
Each numbered round is a directly comparable request pair using the same
realistic legal-document sample:
1. call **avalai**
2. call the **official** provider
3. repeat steps 1-2 for the next round
Round 1 primes both caches. ``round_delay`` is applied once after that pair
before round 2 reads them. Calls are deliberately sequential; accepting
``concurrency`` here preserves CLI compatibility, but pairing takes
precedence so timing and request order cannot differ between endpoints.
Returns ``(avalai, official)`` metrics.
"""
if concurrency != 1:
print(
" paired endpoint schedule enforces sequential calls; "
f"ignoring concurrency={concurrency}"
)
avalai_metrics: list[RoundMetrics] = []
official_metrics: list[RoundMetrics] = []
avalai_previous_id: str | None = None
official_previous_id: str | None = None
for round_id in range(1, rounds + 1):
phase = "priming" if round_id == 1 else "reading"
print(f" round {round_id}: [avalai/{api}] {phase}...")
avalai_metric, avalai_previous_id = await run_round(
avalai_cfg, round_id, document, api, avalai_previous_id
)
avalai_metrics.append(avalai_metric)
if avalai_metric.error is None:
print(
" usage reports: "
f"prompt_tokens={avalai_metric.prompt_tokens}, "
f"cached_tokens={avalai_metric.cached_tokens}"
)
print(f" round {round_id}: [{official_cfg.name}/{api}] {phase}...")
official_metric, official_previous_id = await run_round(
official_cfg, round_id, document, api, official_previous_id
)
official_metrics.append(official_metric)
if official_metric.error is None:
print(
" usage reports: "
f"prompt_tokens={official_metric.prompt_tokens}, "
f"cached_tokens={official_metric.cached_tokens}"
)
if round_id == 1 and rounds >= 2 and round_delay > 0:
print(
f" waiting {round_delay:.1f}s after the paired priming "
"calls for cache propagation..."
)
await asyncio.sleep(round_delay)
return avalai_metrics, official_metrics
# ---------------------------------------------------------------------------
# Statistics
# ---------------------------------------------------------------------------
def _percentile(values: Sequence[float], pct: float) -> float:
if not values:
return 0.0
ordered = sorted(values)
if len(ordered) == 1:
return ordered[0]
k = (len(ordered) - 1) * pct
lo = int(k)
hi = min(lo + 1, len(ordered) - 1)
frac = k - lo
return ordered[lo] + (ordered[hi] - ordered[lo]) * frac
def summarize(endpoint: str, api: str, rounds: int,
metrics: list[RoundMetrics]) -> EndpointSummary:
successful = [m for m in metrics if m.error is None]
ratios = [m.cache_hit_ratio for m in successful]
warm = [m.cache_hit_ratio for m in successful if m.round_id >= 2]
first_hit_round: int | None = None
first_hit_latency: float | None = None
for m in sorted(successful, key=lambda r: r.round_id):
if m.cached_tokens > 0:
first_hit_round = m.round_id
first_hit_latency = m.latency
break
return EndpointSummary(
endpoint=endpoint,
api=api,
rounds=rounds,
successful=len(successful),
mean_hit_ratio=statistics.mean(ratios) if ratios else 0.0,
median_hit_ratio=statistics.median(ratios) if ratios else 0.0,
p90_hit_ratio=_percentile(ratios, 0.90),
first_hit_round=first_hit_round,
first_hit_latency=first_hit_latency,
mean_latency=(
statistics.mean(m.latency for m in successful)
if successful else 0.0
),
mean_ttft=(
statistics.mean(m.ttft for m in successful)
if successful else 0.0
),
warm_mean_hit_ratio=statistics.mean(warm) if warm else 0.0,
per_round=metrics,
)
# ---------------------------------------------------------------------------
# Reporting
# ---------------------------------------------------------------------------
def print_comparison(model: str, avalai: EndpointSummary,
official: EndpointSummary) -> None:
print("\n================ Cache-Hit Ratio Comparison ================")
print(f"Model: {model}")
print(f"API: v1/{avalai.api}")
print(f"avalai vs {official.endpoint}\n")
header = (
f"{'Round':>5} | "
f"{'avalai prompt/cached (ratio)':>34} | "
f"{official.endpoint + ' prompt/cached (ratio)':>34} | "
f"{'Δ ratio':>8}"
)
print(header)
print("-" * len(header))
by_round_a = {m.round_id: m for m in avalai.per_round}
by_round_o = {m.round_id: m for m in official.per_round}
all_rounds = sorted(set(by_round_a) | set(by_round_o))
for rid in all_rounds:
a = by_round_a.get(rid)
o = by_round_o.get(rid)
def _cell(m: RoundMetrics | None) -> str:
if m is None:
return "n/a"
if m.error is not None:
return f"ERROR ({m.error[:22]})"
return (
f"{m.prompt_tokens}/{m.cached_tokens} "
f"({m.cache_hit_ratio * 100:5.1f}%)"
)
delta = ""
if a and o and a.error is None and o.error is None:
delta = f"{(a.cache_hit_ratio - o.cache_hit_ratio) * 100:+6.1f}%"
print(
f"{rid:>5} | {_cell(a):>34} | {_cell(o):>34} | {delta:>8}"
)
failures = [
metric
for summary in (avalai, official)
for metric in summary.per_round
if metric.error is not None
]
if failures:
print("\n---------------- Full errors ----------------")
for metric in failures:
print(
f"[{metric.endpoint}/v1/{metric.api} round {metric.round_id}] "
f"{metric.error}"
)
print("\n---------------- Summary ----------------")
for s in (avalai, official):
fh = (
f"round {s.first_hit_round} ({s.first_hit_latency:.3f}s)"
if s.first_hit_round is not None else "never"
)
print(
f"[{s.endpoint}/v1/{s.api}] successful={s.successful}/{s.rounds} | "
f"mean={s.mean_hit_ratio * 100:.1f}% | "
f"median={s.median_hit_ratio * 100:.1f}% | "
f"p90={s.p90_hit_ratio * 100:.1f}% | "
f"warm(≥2)={s.warm_mean_hit_ratio * 100:.1f}% | "
f"first-hit={fh} | "
f"mean-latency={s.mean_latency:.3f}s | "
f"mean-ttft={s.mean_ttft:.3f}s"
)
warm_delta = (
avalai.warm_mean_hit_ratio - official.warm_mean_hit_ratio
) * 100
print(
f"\nWarm-cache hit-ratio delta (avalai − {official.endpoint}): "
f"{warm_delta:+.1f} percentage points"
)
def print_endpoint_comparison(summaries: Sequence[EndpointSummary]) -> None:
"""Compare warm-cache performance across both APIs for each service."""
print("\n================ Endpoint Comparison =======================")
print(
f"{'Service':>18} | {'API':>18} | {'Warm hit':>9} | "
f"{'Mean latency':>12} | {'Mean TTFT':>9} | {'Success':>9}"
)
print("-" * 91)
for summary in summaries:
print(
f"{summary.endpoint:>18} | {'v1/' + summary.api:>18} | "
f"{summary.warm_mean_hit_ratio * 100:>8.1f}% | "
f"{summary.mean_latency:>11.3f}s | {summary.mean_ttft:>8.3f}s | "
f"{summary.successful:>4}/{summary.rounds:<4}"
)
def persist_json(model: str, config: dict[str, Any],
summaries: Mapping[str, EndpointSummary]) -> Path:
RESULTS_DIR.mkdir(parents=True, exist_ok=True)
stamp = datetime.now(timezone.utc).strftime("%Y%m%d_%H%M%S")
safe_model = model.replace("/", "_").replace(":", "_")
path = RESULTS_DIR / f"cache_hit_{safe_model}_{stamp}.json"
def _dump(s: EndpointSummary) -> dict[str, Any]:
d = asdict(s)
d["per_round"] = [asdict(m) for m in s.per_round]
return d
payload = {
"generated_at": datetime.now(timezone.utc).isoformat(),
"model": model,
"config": config,
"results": {key: _dump(summary) for key, summary in summaries.items()},
}
path.write_text(json.dumps(payload, indent=2))
print(f"\nSaved JSON: {path}")
return path
def render_charts(model: str, avalai: EndpointSummary,
official: EndpointSummary) -> list[Path]:
"""Grouped-bar (per-round hit ratio) + cumulative-hit-ratio line charts.
matplotlib is imported lazily and guarded — the benchmark still produces
the table + JSON when it is missing.
"""
try:
import matplotlib
matplotlib.use("Agg")
import matplotlib.pyplot as plt
except Exception as exc: # noqa: BLE001
print(
f"\n[charts skipped] matplotlib unavailable ({exc}). "
f"Install with: pip install matplotlib"
)
return []
RESULTS_DIR.mkdir(parents=True, exist_ok=True)
stamp = datetime.now(timezone.utc).strftime("%Y%m%d_%H%M%S")
safe_model = model.replace("/", "_").replace(":", "_")
safe_api = avalai.api.replace(".", "_")
saved: list[Path] = []
a_rounds = {m.round_id: m for m in avalai.per_round}
o_rounds = {m.round_id: m for m in official.per_round}
rounds = sorted(set(a_rounds) | set(o_rounds))
def _ratio_series(source: dict[int, RoundMetrics]) -> list[float]:
series: list[float] = []
for r in rounds:
m = source.get(r)
series.append(m.cache_hit_ratio * 100 if m is not None else 0.0)
return series
a_ratio = _ratio_series(a_rounds)
o_ratio = _ratio_series(o_rounds)
# 1) Grouped bar: per-round hit ratio.
fig, ax = plt.subplots(figsize=(10, 5))
width = 0.4
x = list(range(len(rounds)))
ax.bar([i - width / 2 for i in x], a_ratio, width, label="avalai")
ax.bar([i + width / 2 for i in x], o_ratio, width,
label=official.endpoint)
ax.set_xticks(x)
ax.set_xticklabels([str(r) for r in rounds])
ax.set_xlabel("Round")
ax.set_ylabel("Cache-hit ratio (%)")
ax.set_ylim(0, 100)
ax.set_title(f"Per-round cache-hit ratio — {model} — v1/{avalai.api}")
ax.legend()
ax.grid(axis="y", alpha=0.3)
bar_path = RESULTS_DIR / f"cache_hit_bar_{safe_model}_{safe_api}_{stamp}.png"
fig.tight_layout()
fig.savefig(bar_path, dpi=120)
plt.close(fig)
saved.append(bar_path)
# 2) Line: cumulative (running-mean) hit ratio.
def _cumulative(ratios: list[float]) -> list[float]:
out: list[float] = []
acc = 0.0
for i, v in enumerate(ratios, start=1):
acc += v
out.append(acc / i)
return out
fig, ax = plt.subplots(figsize=(10, 5))
ax.plot(rounds, _cumulative(a_ratio), marker="o", label="avalai")
ax.plot(rounds, _cumulative(o_ratio), marker="s",
label=official.endpoint)
ax.set_xlabel("Round")
ax.set_ylabel("Cumulative mean hit ratio (%)")
ax.set_ylim(0, 100)
ax.set_title(f"Cumulative cache-hit ratio — {model} — v1/{avalai.api}")
ax.legend()
ax.grid(alpha=0.3)
line_path = RESULTS_DIR / f"cache_hit_line_{safe_model}_{safe_api}_{stamp}.png"
fig.tight_layout()
fig.savefig(line_path, dpi=120)
plt.close(fig)
saved.append(line_path)
for p in saved:
print(f"Saved chart: {p}")
return saved
# ---------------------------------------------------------------------------
# CLI + orchestration
# ---------------------------------------------------------------------------
def build_arg_parser() -> argparse.ArgumentParser:
parser = argparse.ArgumentParser(
description=(
"Compare prompt-cache hit ratios between AvalAI and a model's "
"official provider over v1/chat/completions and v1/responses."
)
)
parser.add_argument(
"--model", default="deepseek-v4-flash",
help="Model id shared by both endpoints (default: deepseek-v4-flash).",
)
parser.add_argument(
"--official-provider", default=None,
help=(
"Override provider inference. One of: openai, claude.ai, "
"deepseek, z.ai, dashscope, moonshot.ai, gemini, xai."
),
)
parser.add_argument(
"--avalai-api-key", default=None,
help=f"AvalAI API key (fallback env: {AVALAI_ENV_VAR}).",
)
parser.add_argument(
"--avalai-base-url", default=AVALAI_DEFAULT_BASE_URL,
help=f"AvalAI base URL (default: {AVALAI_DEFAULT_BASE_URL}).",
)
# One --<provider>-api-key flag per official provider.
for spec in PROVIDER_REGISTRY.values():
parser.add_argument(
spec.cli_flag, dest=spec.dest, default=None,
help=f"{spec.label} API key (fallback env: {spec.env_var}).",
)
parser.add_argument("--rounds", type=int, default=5,
help="Total rounds per endpoint (default: 5).")
parser.add_argument(
"--prefix-tokens", type=int, default=4000,
help=(
"Approximate legal-document sample size in tokens "
"(default: 4000; clamped to the provider minimum)."
),
)
parser.add_argument(
"--concurrency", type=int, default=1,
help=(
"Retained for CLI compatibility. Endpoint calls are always paired "
"sequentially (AvalAI then official), so values above 1 are ignored."
),
)
parser.add_argument(
"--max-tokens", type=int, default=64,
help="max_tokens for each completion (default: 64).",
)
parser.add_argument(
"--request-timeout", type=float, default=120.0,
help=(
"Wall-clock ceiling (seconds) for a single round: connect + the "
"entire stream. Guards against a proxy/upstream that keeps the "
"socket open but never completes (default: 120.0)."
),
)
parser.add_argument(
"--stream-idle-timeout", type=float, default=60.0,
help=(
"Max seconds allowed between two consecutive stream chunks before "
"the round is aborted as a stall. Trips before --request-timeout "
"when a stream freezes mid-flight, e.g. the final usage/priced "
"chunk never arrives (default: 60.0)."
),
)
parser.add_argument(
"--round-delay", type=float, default=15.0,
help=(
"Seconds to wait once, right after the cache-priming round of each "
"provider, giving the AvalAI service time to propagate the cache "
"session before the read rounds (default: 15.0; set 0 to disable)."
),
)
parser.add_argument("--no-charts", action="store_true",
help="Skip matplotlib chart generation.")
return parser
def _resolve_key(cli_value: str | None, env_var: str) -> str | None:
if cli_value:
return cli_value
return os.getenv(env_var) or None
def resolve_keys(args: argparse.Namespace,
spec: ProviderSpec) -> tuple[str, str]:
"""Resolve AvalAI + official keys, failing fast with a clear error.
Validation happens BEFORE any AvalAI request is issued.
"""
official_cli = getattr(args, spec.dest, None)
official_key = _resolve_key(official_cli, spec.env_var)
if not official_key:
raise SystemExit(
f"Missing official-provider API key for '{spec.label}'. "
f"Pass {spec.cli_flag} or set ${spec.env_var}."
)
avalai_key = _resolve_key(args.avalai_api_key, AVALAI_ENV_VAR)
if not avalai_key:
raise SystemExit(
f"Missing AvalAI API key. Pass --avalai-api-key or set "
f"${AVALAI_ENV_VAR}."
)
return avalai_key, official_key
async def run_benchmark(args: argparse.Namespace) -> None:
spec = resolve_provider(args.model, args.official_provider)
# Fail fast on missing keys before touching the network.
avalai_key, official_key = resolve_keys(args, spec)
min_tokens = spec.min_cache_tokens
document = build_sample_document(args.prefix_tokens, min_tokens)
experiments = ("chat.completions", "responses")
print(
f"Model={args.model} | official={spec.label} | "
f"rounds={args.rounds} | sample≈{args.prefix_tokens} tokens "
f"(min {min_tokens}) | concurrency={args.concurrency}"
)
print(
" cache-hit source of truth: response usage dict "
"(prompt_tokens_details.cached_tokens / prompt_tokens)"
)
avalai_cfg = EndpointConfig(
name="avalai",
transport="openai", # AvalAI is OpenAI-compatible for all models.
base_url=args.avalai_base_url,
api_key=avalai_key,
model=args.model,
extractor=spec.extractor,
max_tokens=args.max_tokens,
request_timeout=args.request_timeout,
stream_idle_timeout=args.stream_idle_timeout,
)
official_cfg = EndpointConfig(
name=spec.label,
transport=spec.transport,
base_url=spec.base_url,
api_key=official_key,
model=args.model,
extractor=spec.extractor,
max_tokens=args.max_tokens,
request_timeout=args.request_timeout,
stream_idle_timeout=args.stream_idle_timeout,
)
summaries: dict[str, EndpointSummary] = {}
for api in experiments:
print(f"\nRunning v1/{api} experiment...")
avalai_metrics, official_metrics = await run_interleaved(
avalai_cfg,
official_cfg,
args.rounds,
document,
args.concurrency,
round_delay=args.round_delay,
api=api,
)
avalai_summary = summarize("avalai", api, args.rounds, avalai_metrics)
official_summary = summarize(
spec.label, api, args.rounds, official_metrics
)
summaries[f"avalai/{api}"] = avalai_summary
summaries[f"official/{api}"] = official_summary
print_comparison(args.model, avalai_summary, official_summary)
print_endpoint_comparison(list(summaries.values()))
config = {
"model": args.model,
"official_provider": spec.key,
"official_label": spec.label,
"rounds": args.rounds,
"prefix_tokens": args.prefix_tokens,
"min_cache_tokens": min_tokens,
"concurrency": args.concurrency,
"max_tokens": args.max_tokens,
"round_delay": args.round_delay,
"request_timeout": args.request_timeout,
"stream_idle_timeout": args.stream_idle_timeout,
"cache_hit_source": "response_usage",
"cache_hit_formula": (
"usage.prompt_tokens_details.cached_tokens / usage.prompt_tokens"
),
"sample": "repeated_legal_document",
"responses_previous_response_id": True,
"avalai_base_url": args.avalai_base_url,
"official_base_url": spec.base_url,
}
persist_json(args.model, config, summaries)
if not args.no_charts:
for api in experiments:
render_charts(
args.model,
summaries[f"avalai/{api}"],
summaries[f"official/{api}"],
)
async def main(argv: list[str] | None = None) -> None:
parser = build_arg_parser()
args = parser.parse_args(argv)
await run_benchmark(args)
if __name__ == "__main__":
asyncio.run(main())
# In a Jupyter notebook, replace the block above with:
# await main([...]) # pass CLI-style args as a listScope and limitations
These three five-round experiments were observed on 2026-08-14. A failed official Responses call means that endpoint was unavailable through the tested public provider API; it does not represent a 0% cache hit on a successful request. Latency includes model and network variability, and one slow call can materially affect a five-round mean. Applications must remain correct on cache misses and must not use cache affinity as conversation state. See Prompt Caching for implementation guidance.
Performance optimization guide
Improve cache-hit ratio
- Put stable instructions, policy text, tool schemas, images, and reusable examples first; dynamic user context and timestamps go last.
- Keep the prefix byte-identical and inspect
usage.prompt_tokens_details.cached_tokensor the provider-native equivalent. - Compare warm requests separately from priming requests and track the model, route, prompt version, request ID, and timestamps.
Reduce latency and improve throughput
- Start with the smallest model that passes your evals; reserve larger reasoning models for hard decisions.
- Limit output with
max_output_tokensfor/v1/responsesormax_completion_tokensfor/v1/chat/completions. - Stream user-facing output to reduce perceived latency, parallelize only independent work, and reuse HTTP connections.
- Reduce unnecessary model calls and combine tightly related steps when one structured response is sufficient.
Measure production behavior
Log TTFT/TTFB, total latency, model, endpoint, input/output/cached tokens, request ID, status, and retry/fallback count. Report p50, p90, and p95 rather than relying on one average. Pair this page with Latency Optimization and Cost Optimization.
Regional latency benchmarks
The latency studies below used AvalAI's primary domain, api.avalai.ir, with the Guardrail feature disabled for a like-for-like core-infrastructure comparison. Guardrails are recommended for most applications but added approximately 200–300ms in these historical tests. The secondary connectivity domain, api.avalapis.ir, has higher latency by design and was not tested.
AvalAI maintains persistent provider connections and connection pools, while request-processing, network, and repeated-call optimizations reduce platform overhead. Geography, model load, output length, security settings, and network conditions still affect every measurement.
Latest regional latency - 2025-10-12
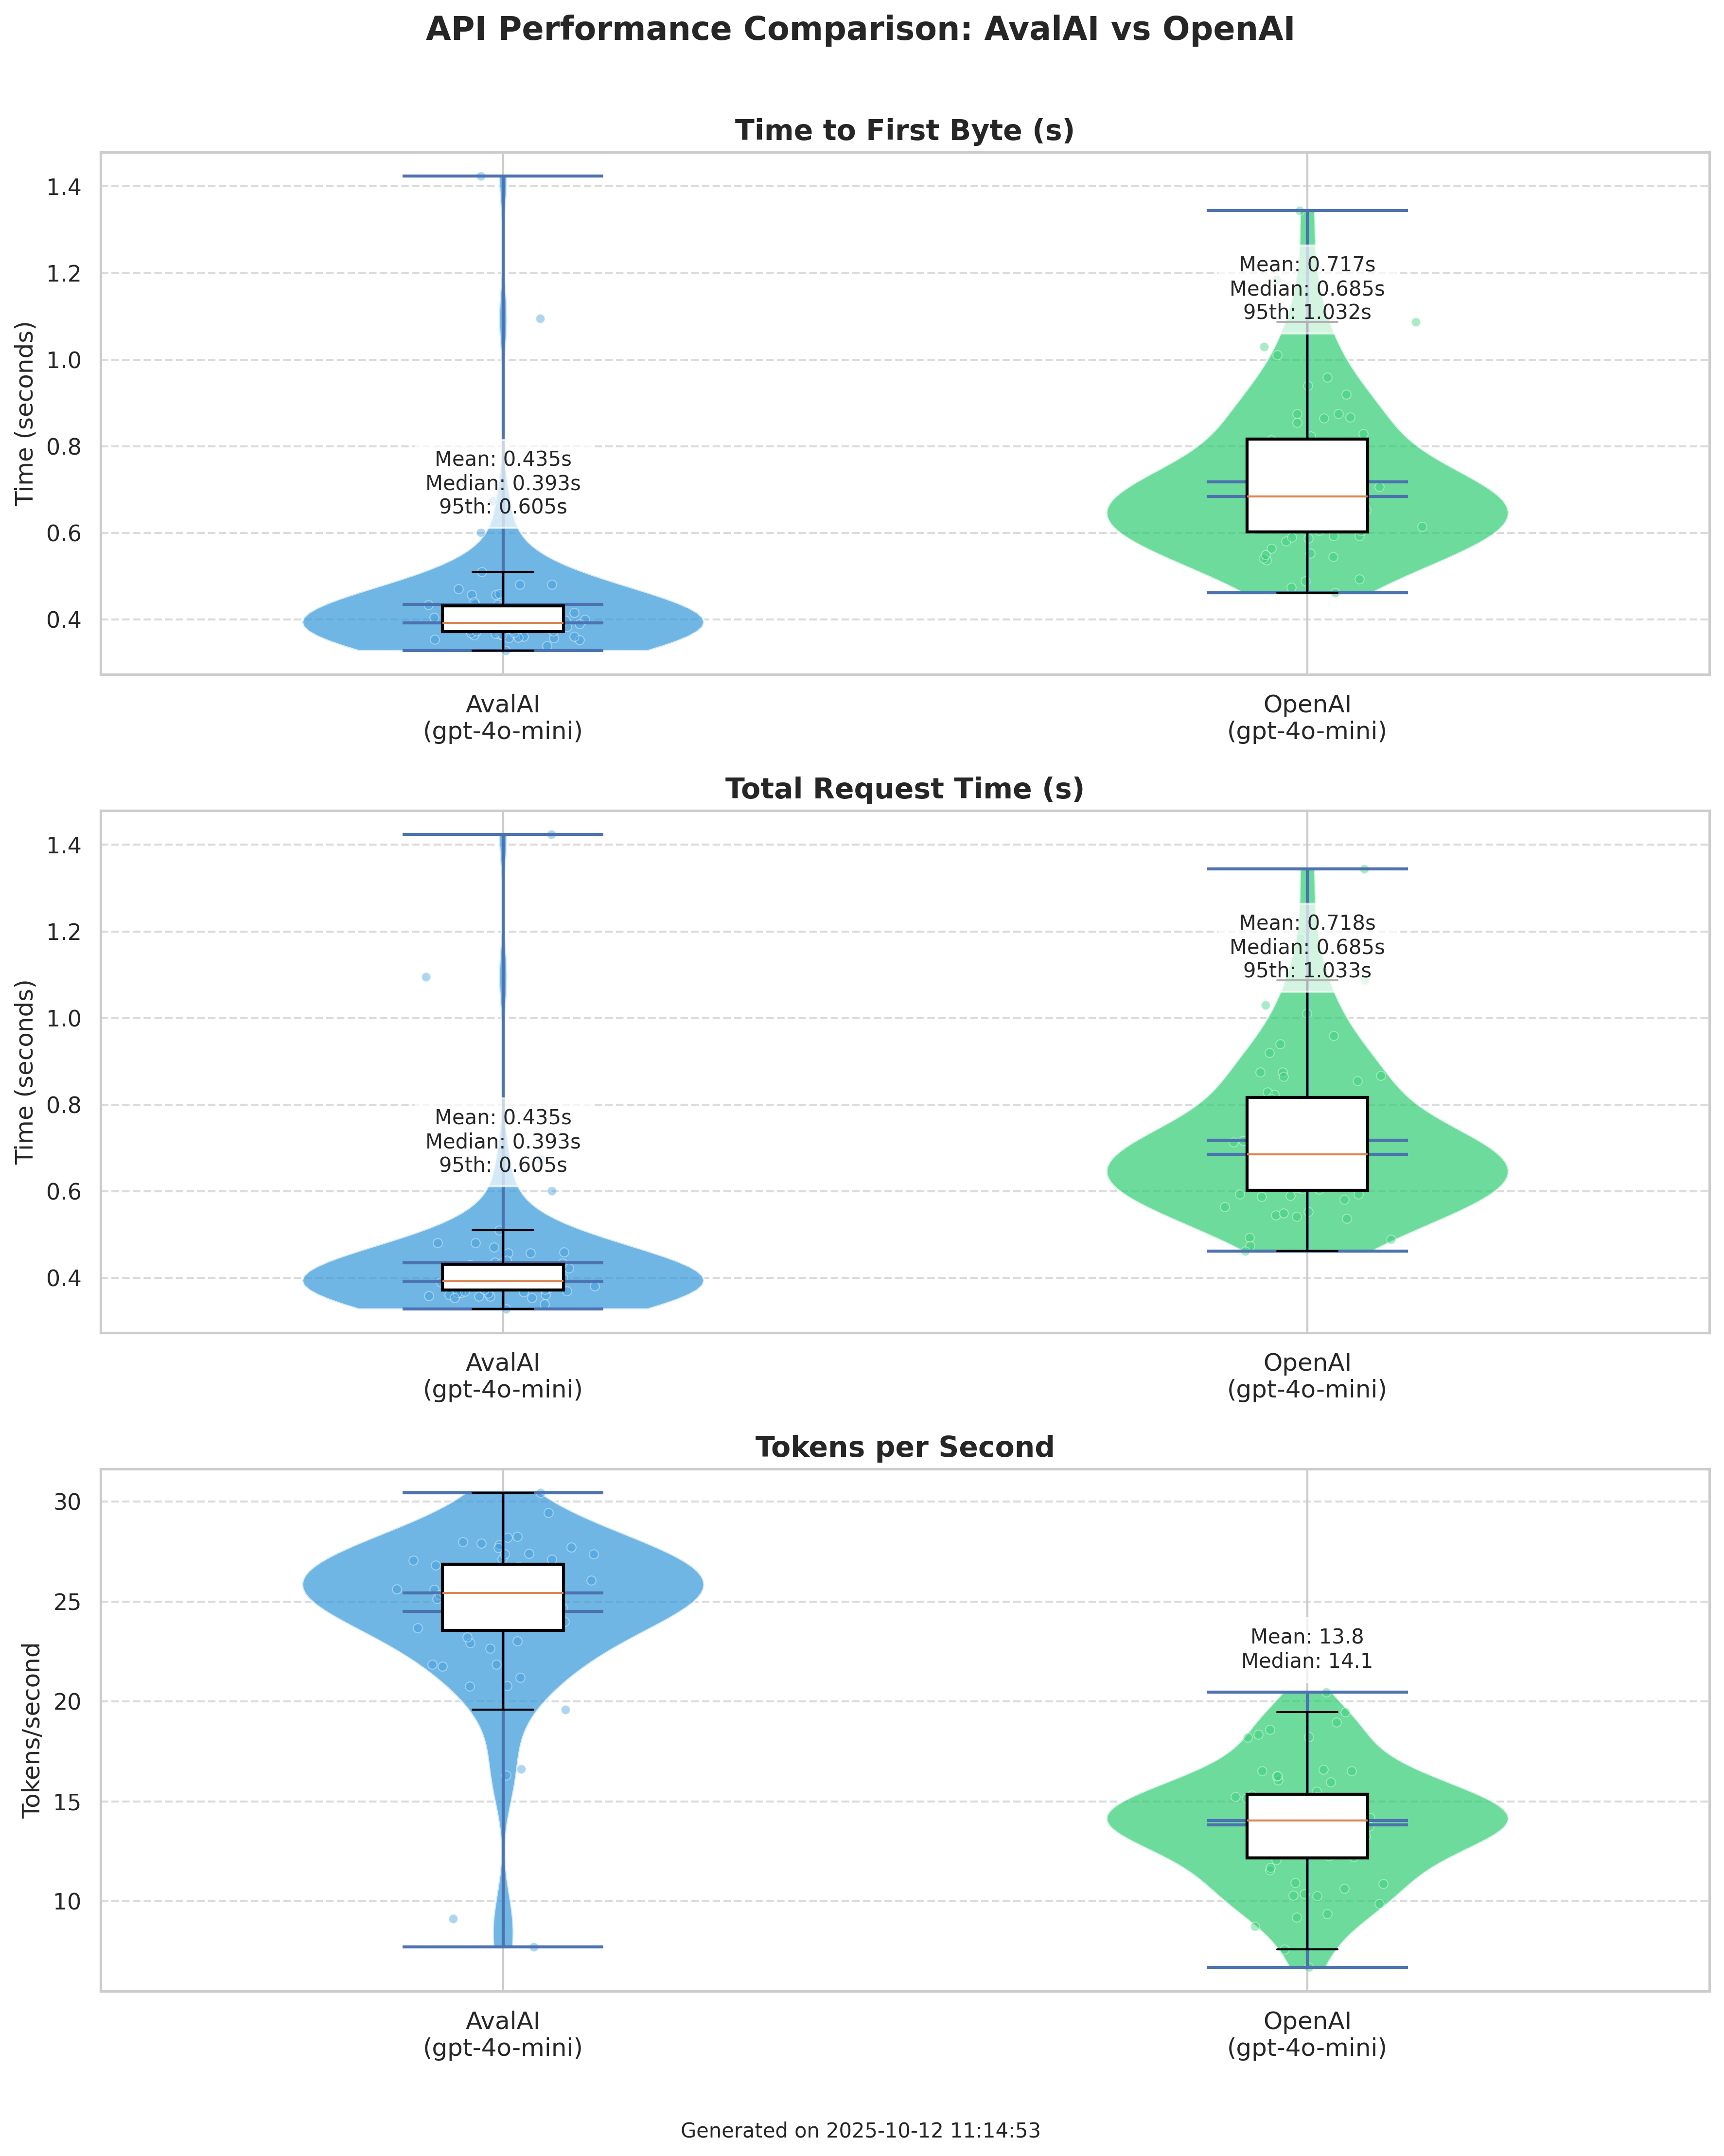
Europe (EU) Datacenter Performance - 2025-10-12
This test was conducted from a virtual machine hosted in an Azure datacenter in the EU, comparing AvalAI's performance to calling OpenAI's API directly from the same location.
Test Environment:
- Model:
gpt-4o-mini - Cloud Provider: Microsoft Azure
- Hardware: 4GB RAM, 2 vCPUs
- Location: Europe
EU Performance Results
| Metric | AvalAI (gpt-4o-mini) | OpenAI (gpt-4o-mini) |
|---|---|---|
| Average TTFB (s) | 0.435 | 0.717 |
| Median TTFB (s) | 0.393 | 0.685 |
| 95th Percentile TTFB (s) | 0.605 | 1.032 |
| Avg Tokens per Second | 24.5 | 13.8 |
| Success Rate | 100.00% | 100.00% |
Analysis
The results speak for themselves: AvalAI is now 39% faster than direct OpenAI access from our EU datacenter. Our median TTFB of 0.393s compared to OpenAI's 0.685s, combined with 77% higher token throughput (24.5 vs 13.8 tokens/sec), demonstrates that a well-architected unified API platform can outperform direct provider access.
This performance advantage stems from our persistent connections to OpenAI's infrastructure and our optimized request handling. While individual users must establish connections and manage overhead with each request, our high-traffic system maintains warm connections and optimized pathways to all providers. Our recent infrastructure optimizations have further reduced any internal overhead, resulting in the superior performance shown in these benchmarks.
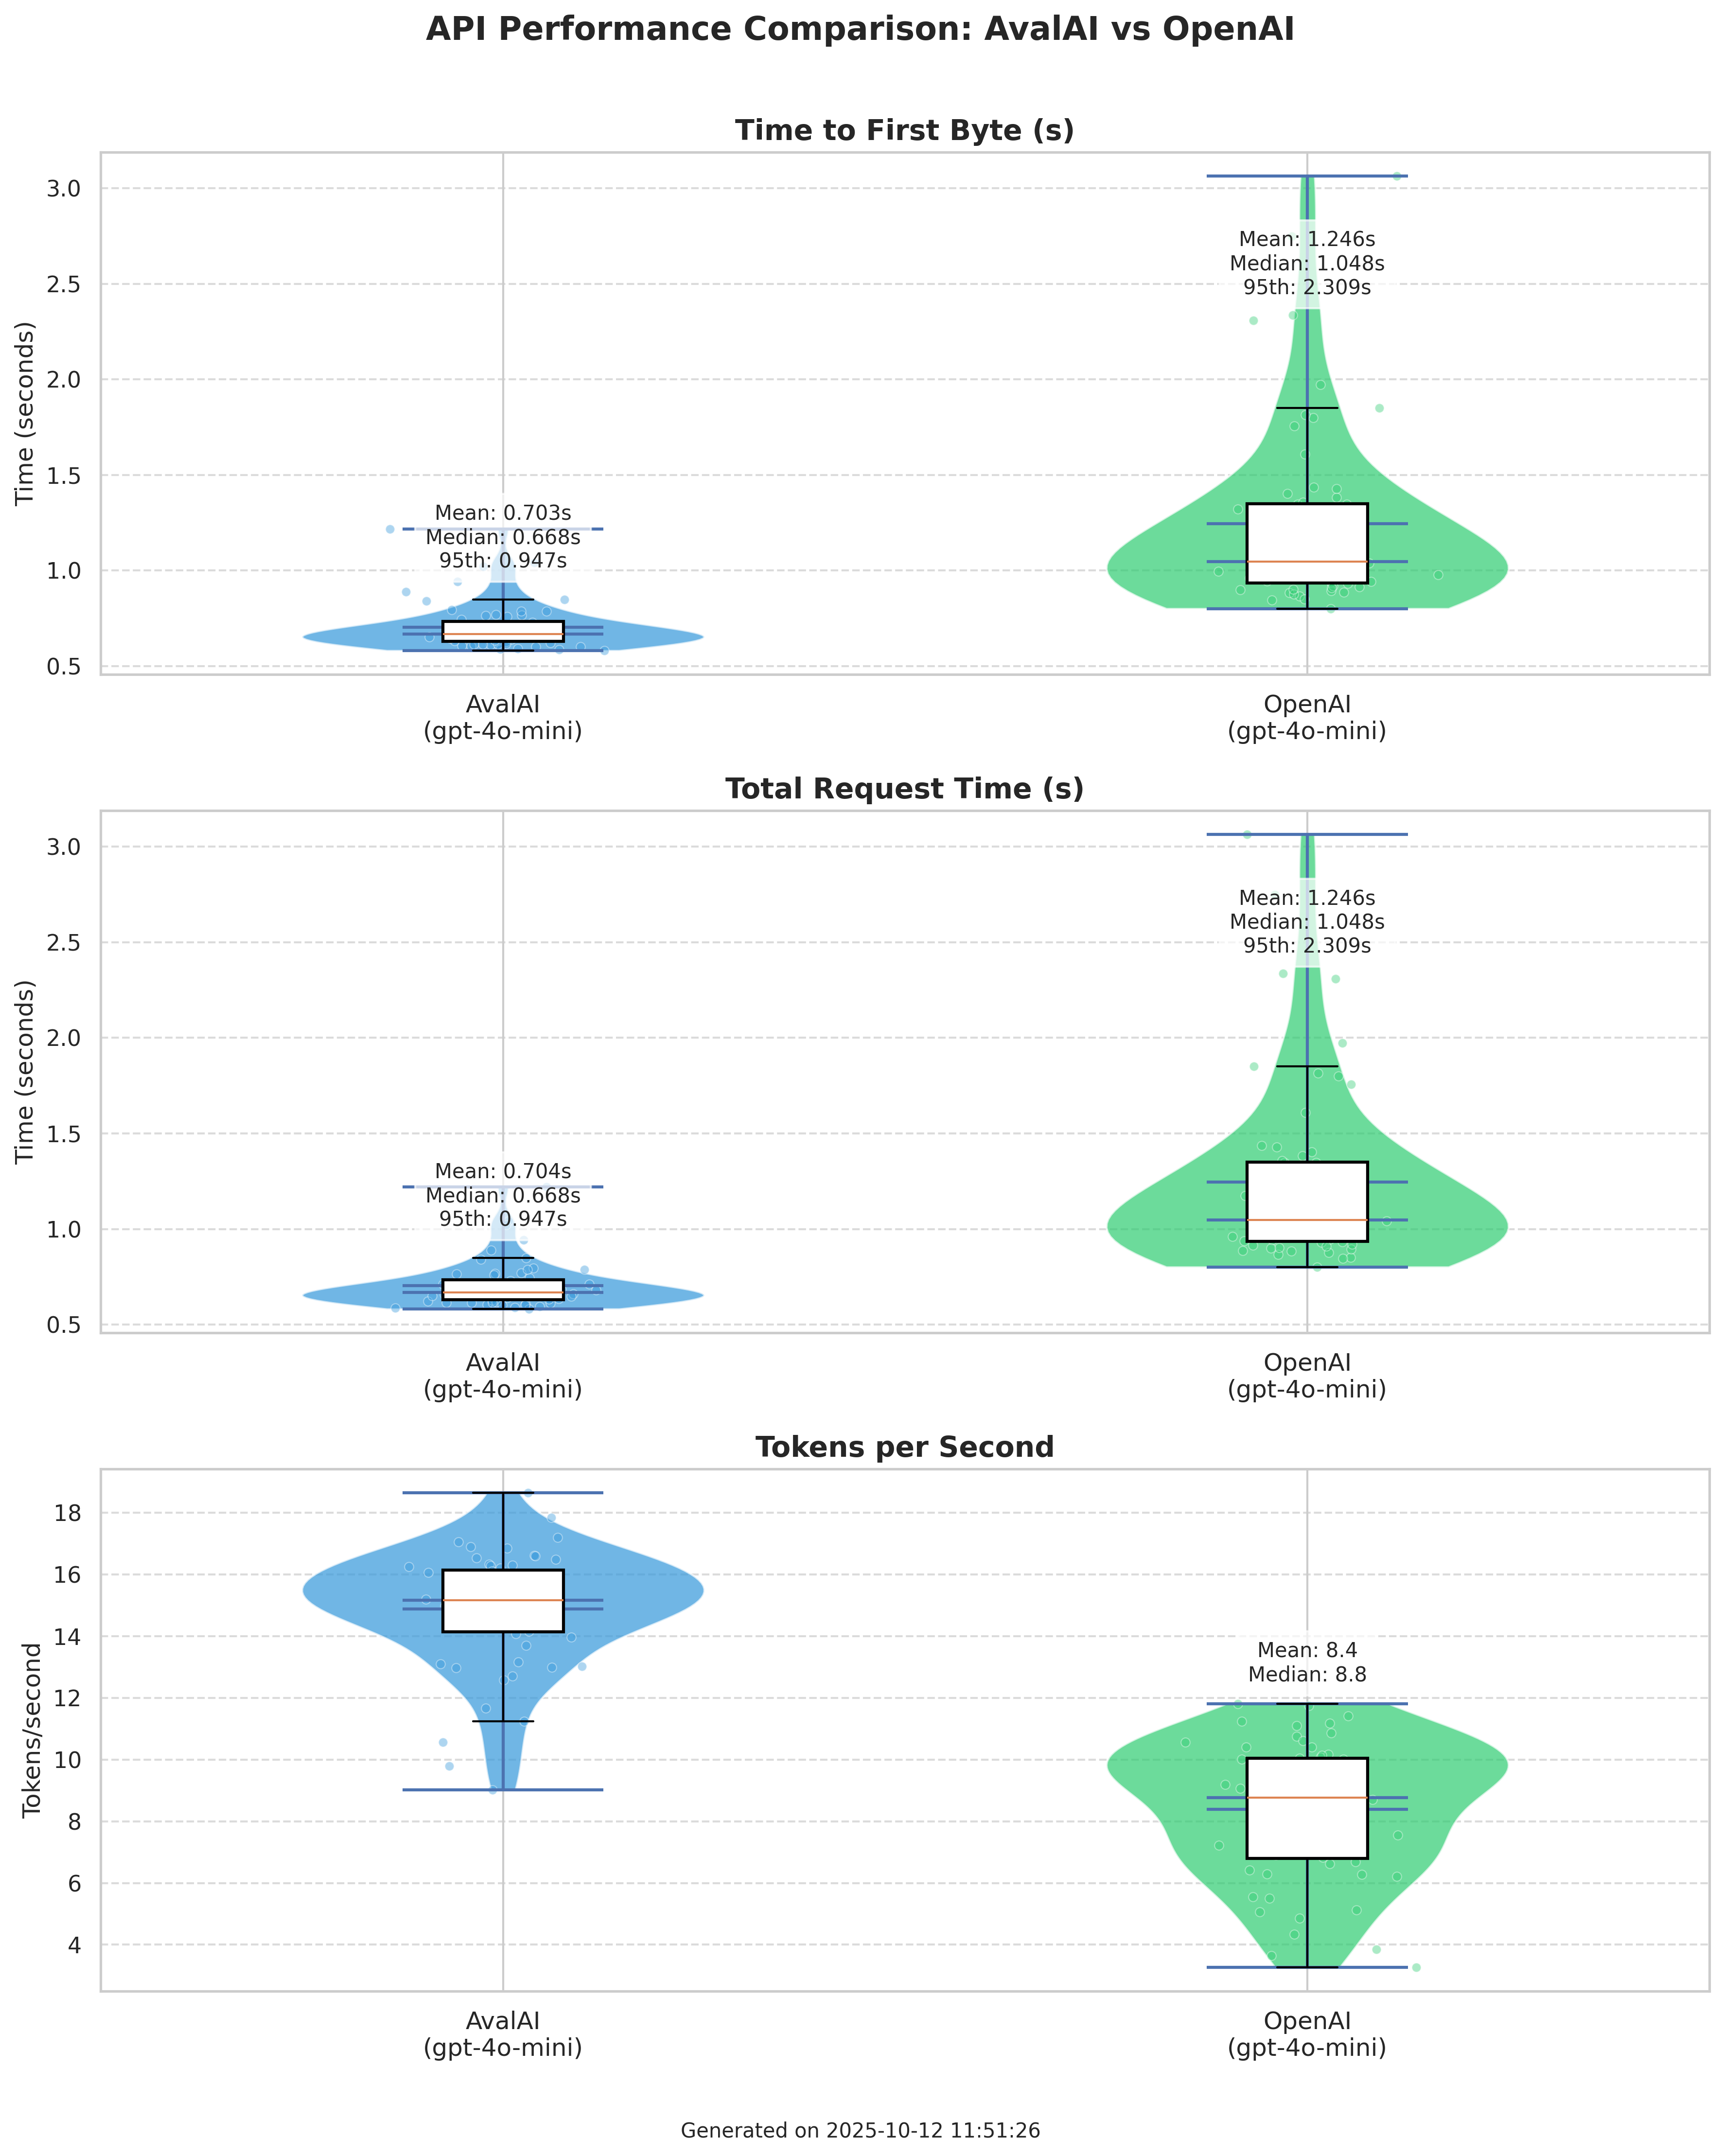
Middle East (ME) Datacenter Performance - 2025-10-12
This test was conducted from a virtual machine hosted in an Arvancloud datacenter in the Middle East, comparing AvalAI's performance to calling OpenAI's API directly from the same location.
Test Environment:
- Model:
gpt-4o-mini - Cloud Provider: Arvancloud
- Hardware: 4GB RAM, 2 vCPUs
- Location: Middle East
ME Performance Results
| Metric | AvalAI (gpt-4o-mini) | OpenAI (gpt-4o-mini) |
|---|---|---|
| Average TTFB (s) | 0.703 | 1.246 |
| Median TTFB (s) | 0.668 | 1.048 |
| 95th Percentile TTFB (s) | 0.947 | 2.309 |
| Avg Tokens per Second | 14.9 | 8.4 |
| Success Rate | 100.00% | 100.00% |
Analysis
The performance advantage is even more pronounced for Middle East users: AvalAI delivers 44% faster response times with a median TTFB of 0.668s compared to OpenAI's 1.048s. Token throughput is 77% higher (14.9 vs 8.4 tokens/sec), providing a substantially better experience for regional deployments.
Our infrastructure's strategic positioning and optimized routing paths, combined with persistent provider connections and recent optimizations, deliver exceptional performance for users in this region. The performance gap compared to direct OpenAI access has widened significantly since our June benchmarks, demonstrating the impact of our optimization efforts.
Historical Performance - June 2025
For transparency and to demonstrate our continuous improvement, we're preserving our previous benchmark results from June 2025. These historical results show the starting point before our recent optimization initiative.
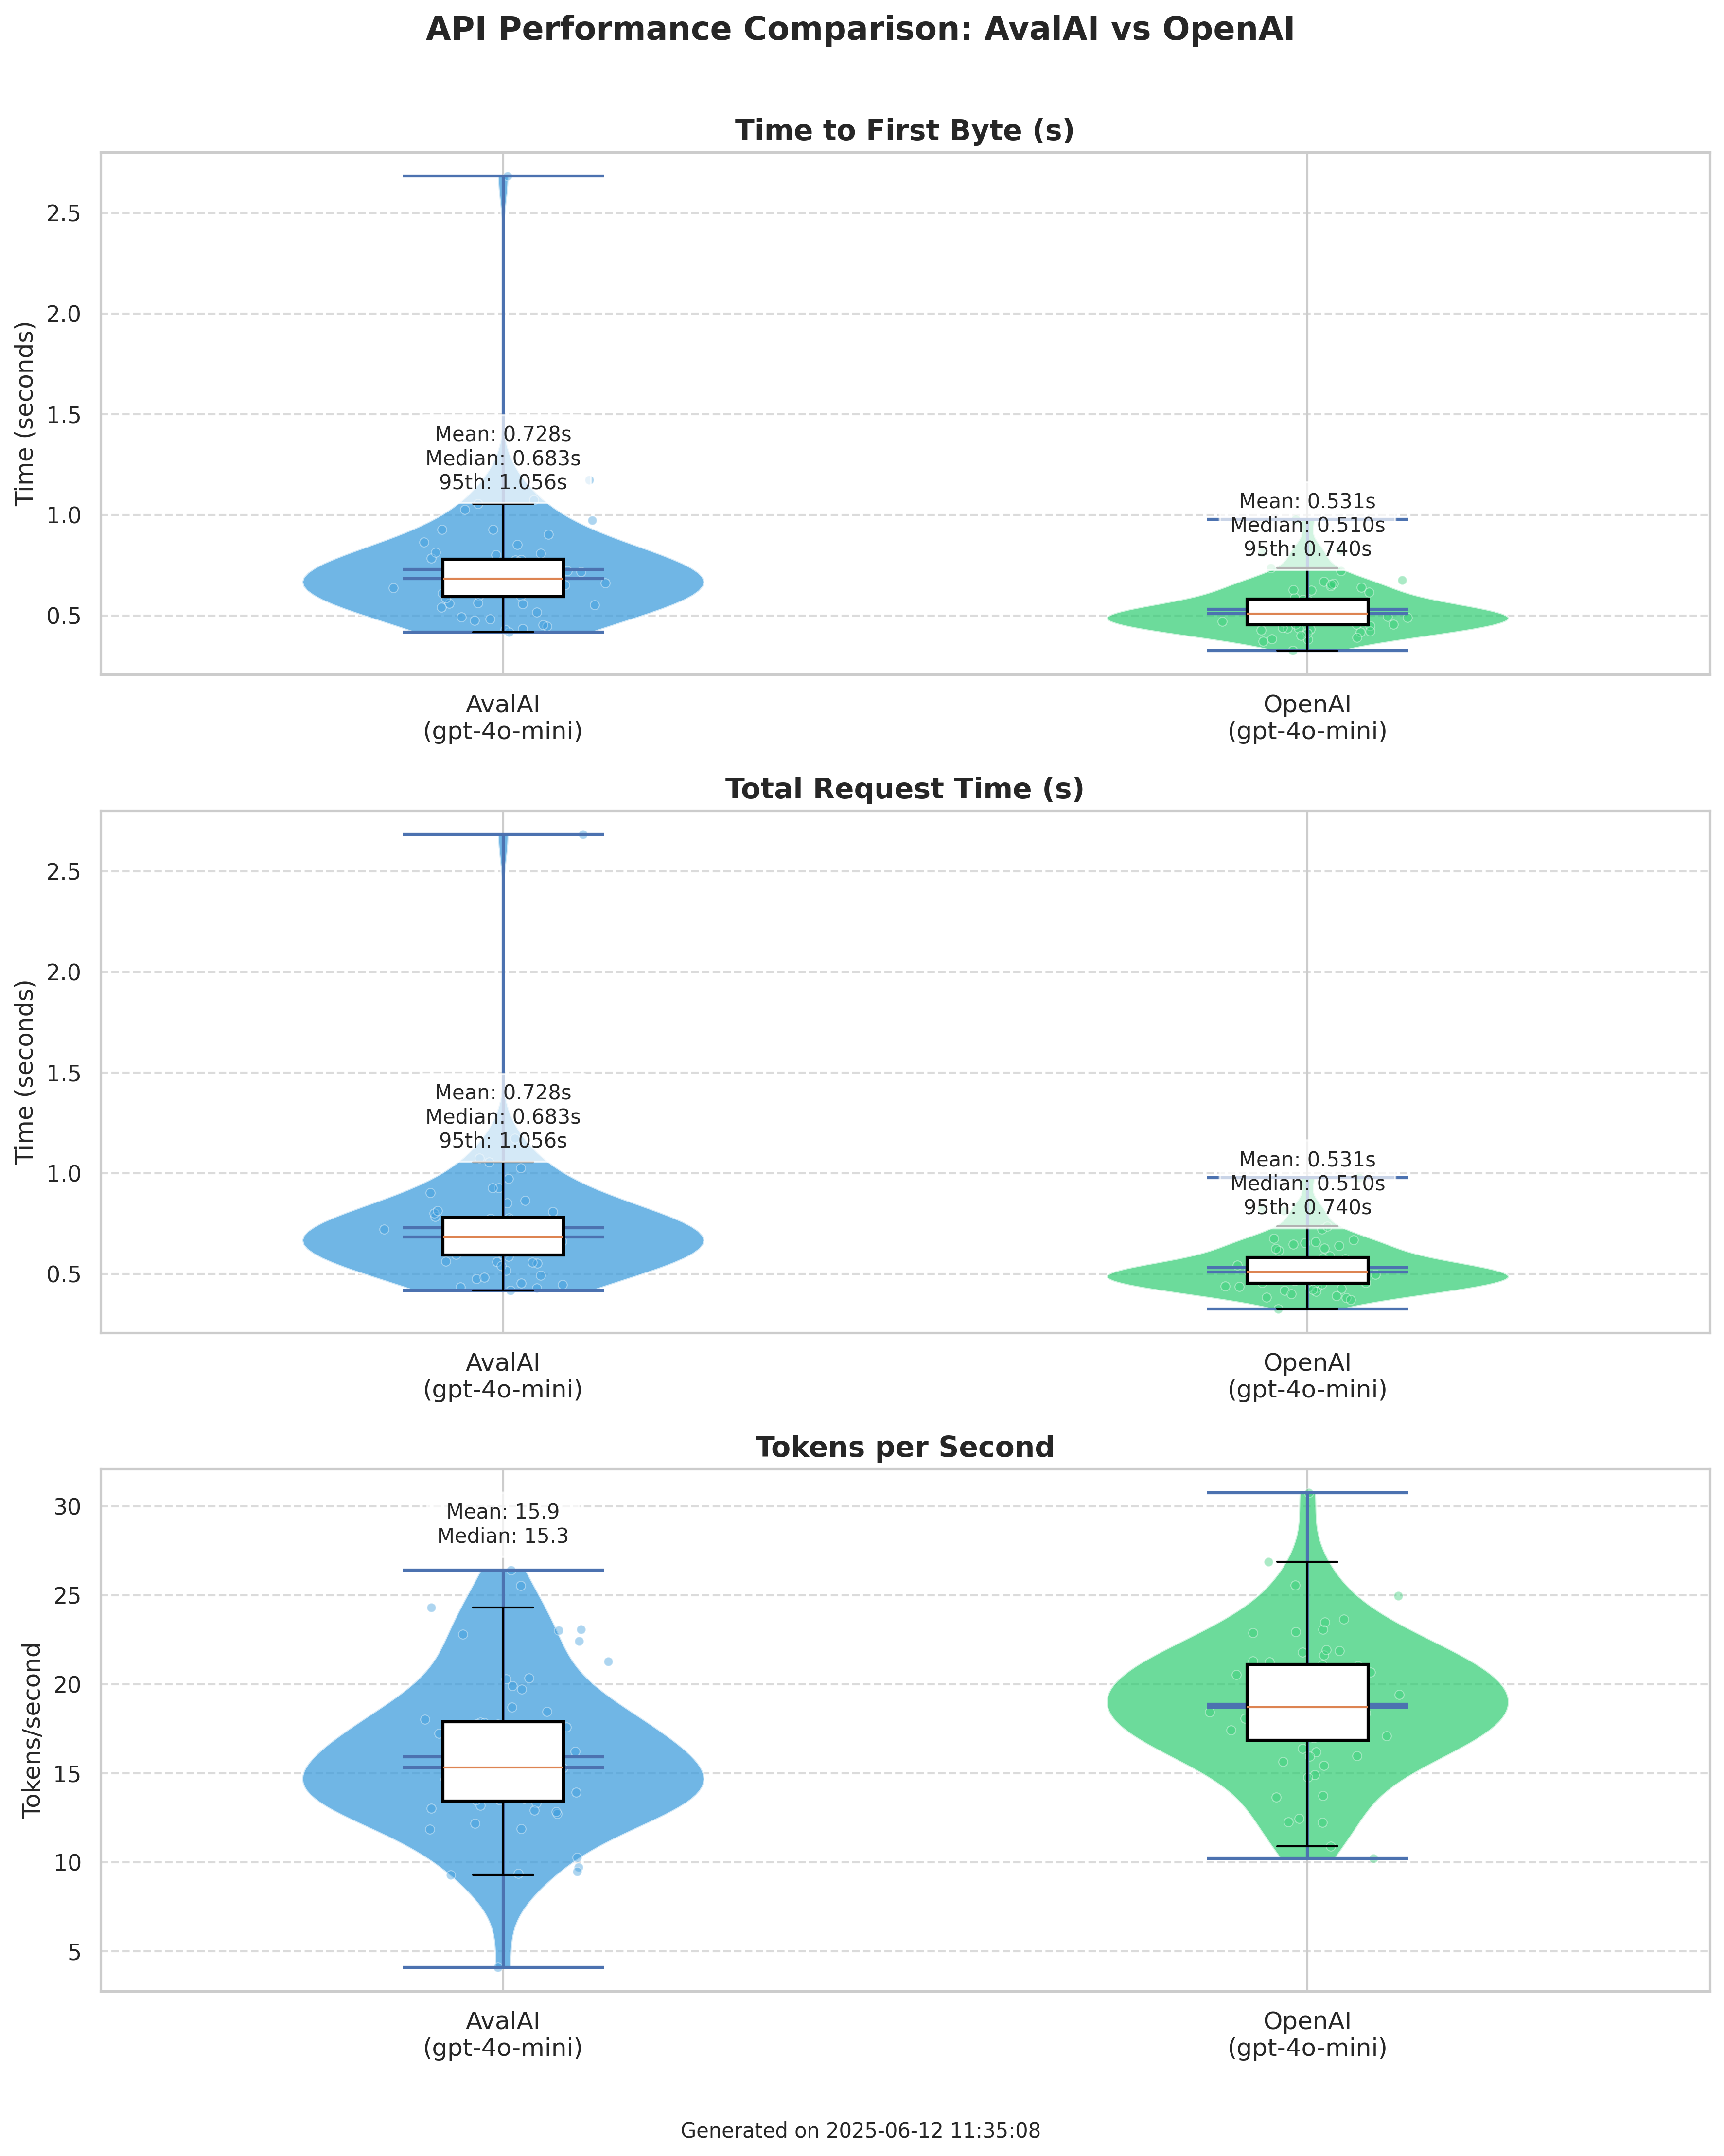
Europe (EU) Datacenter Performance - 2025-06-12
Test Environment:
- Model:
gpt-4o-mini - Cloud Provider: Microsoft Azure
- Location: Europe
EU Performance Results (Historical)
| Metric | AvalAI (gpt-4o-mini) | OpenAI (gpt-4o-mini) |
|---|---|---|
| Average TTFB (s) | 0.728 | 0.531 |
| Median TTFB (s) | 0.683 | 0.510 |
| 95th Percentile TTFB (s) | 1.056 | 0.740 |
| Avg Tokens per Second | 15.9 | 18.9 |
| Success Rate | 100.00% | 100.00% |
Historical Analysis
In June 2025, AvalAI showed a minor latency overhead of approximately 200ms compared to a direct OpenAI call from Azure datacenters. This was expected given OpenAI's primary hosting on Azure infrastructure. The value-added services we provided—unified API routing, robust security layers, and multi-provider support—came with this slight overhead.
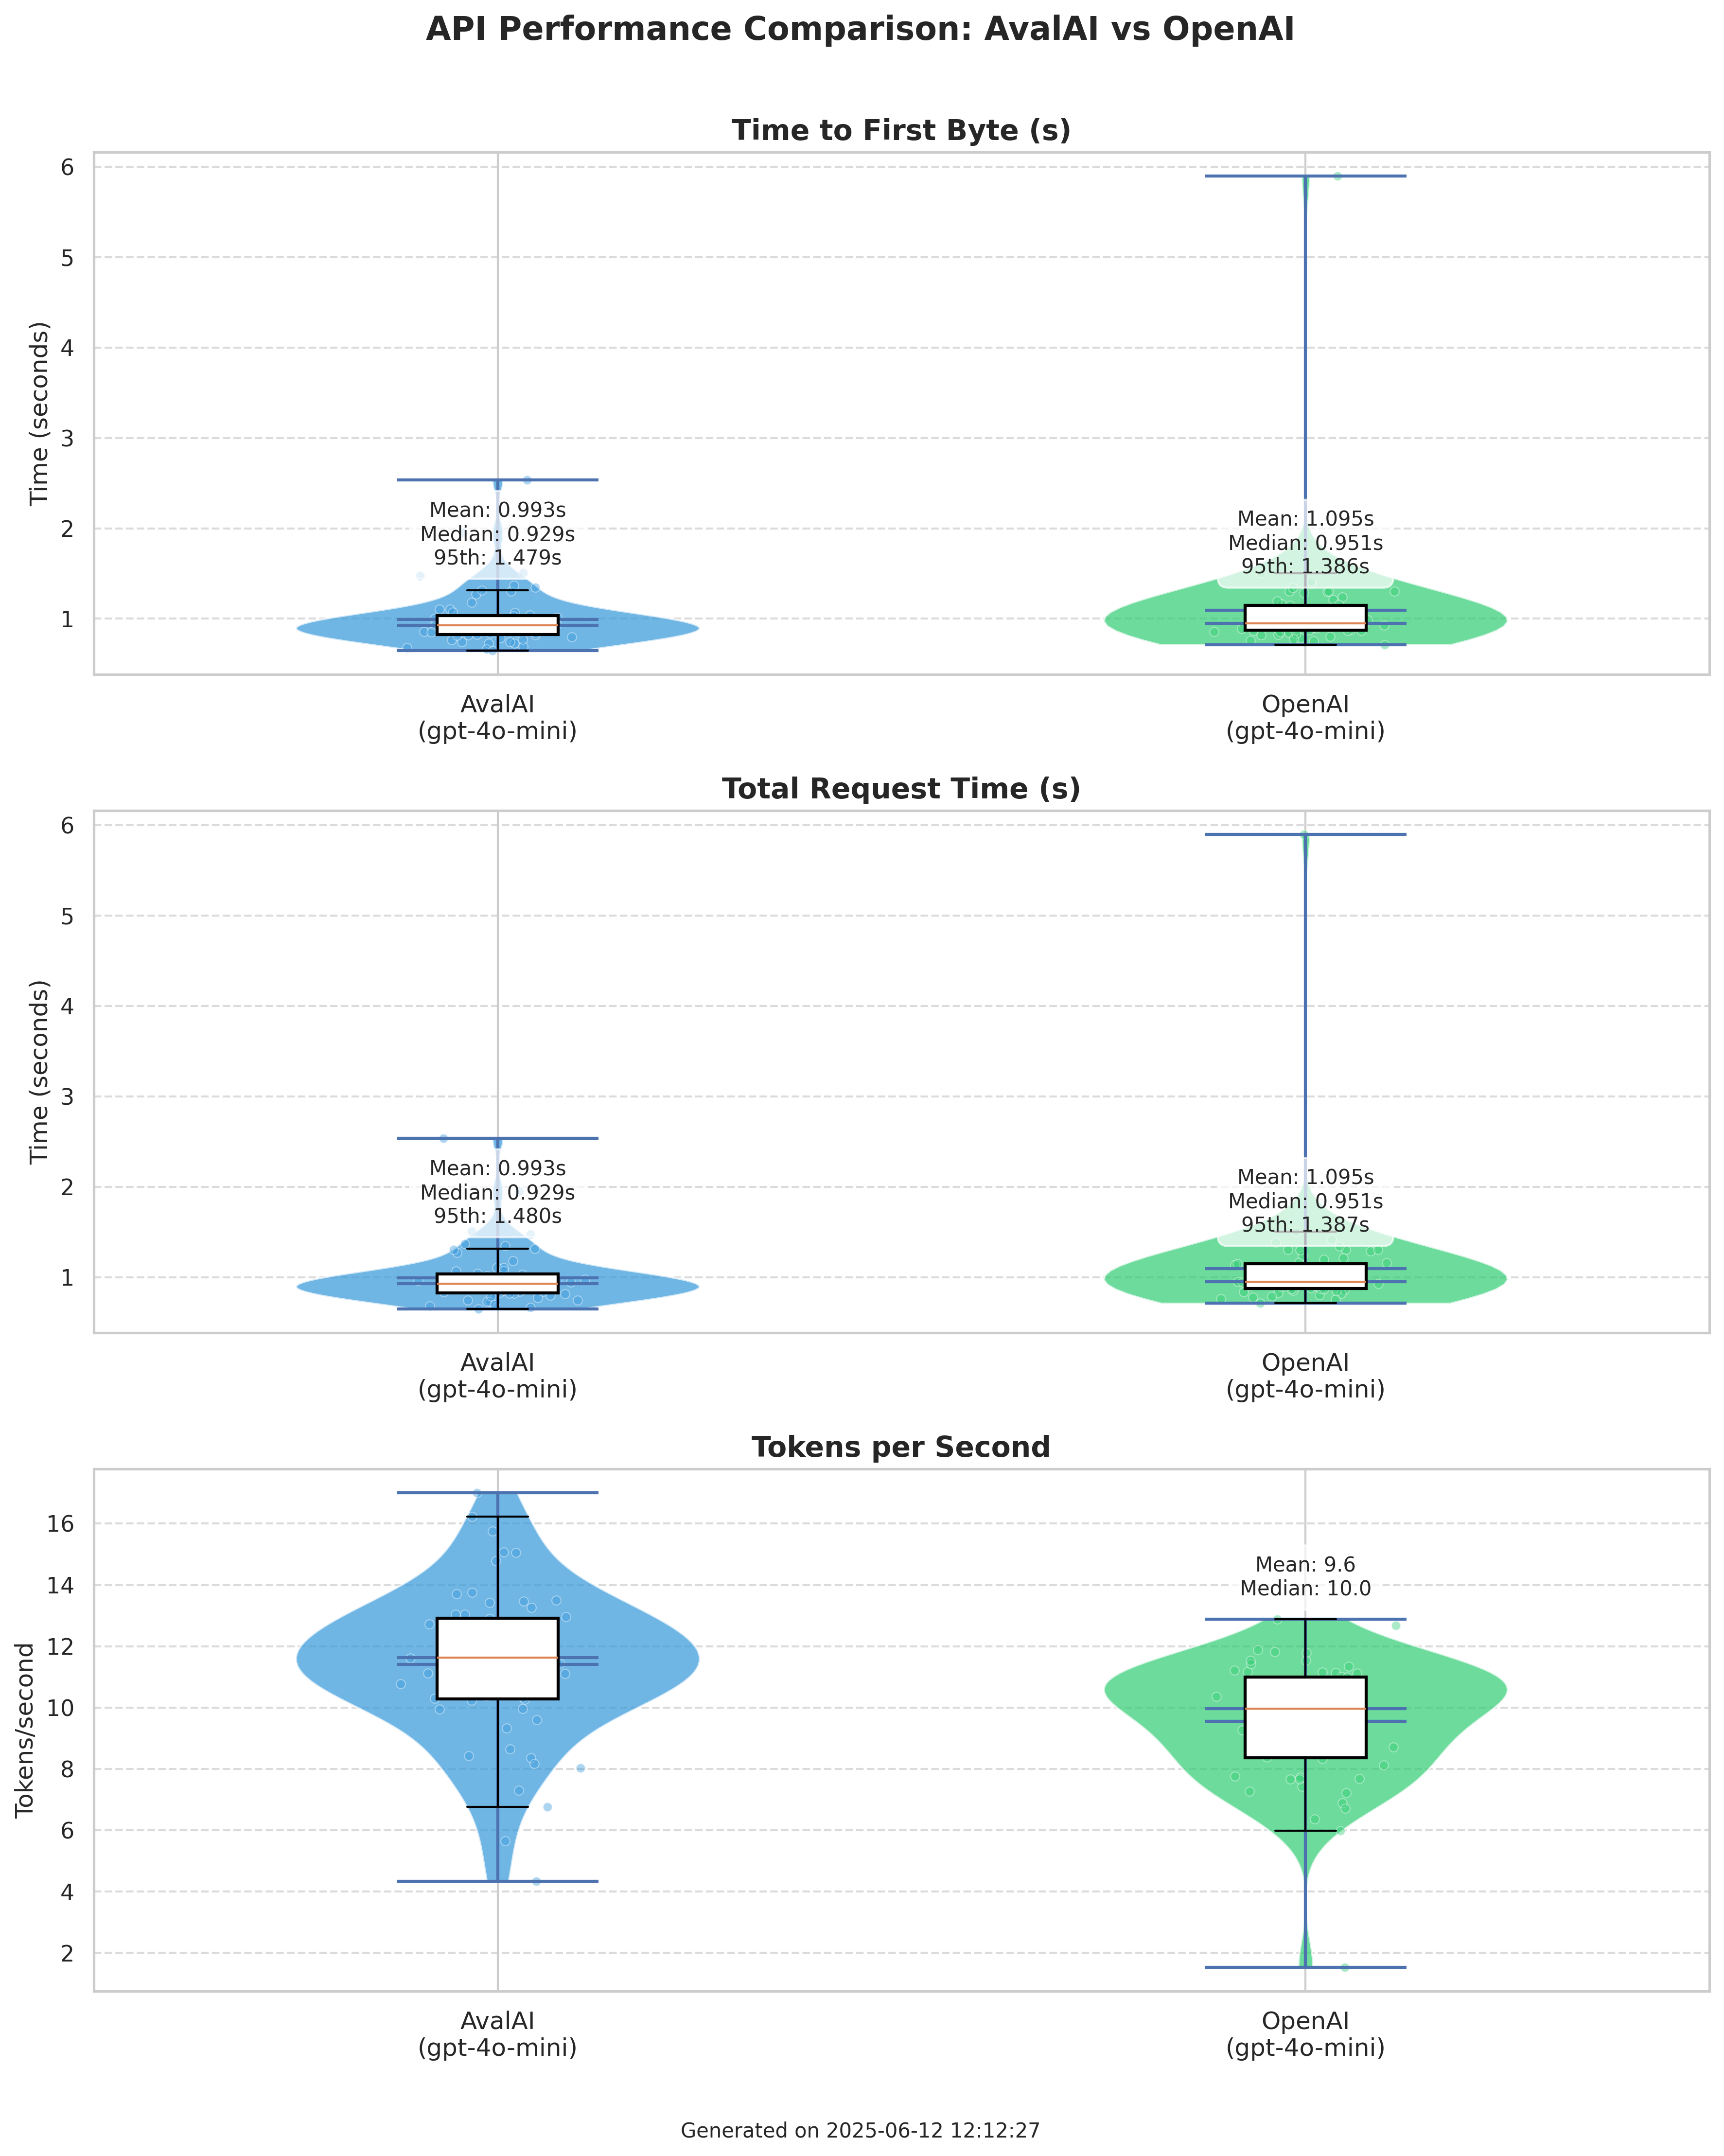
Middle East (ME) Datacenter Performance - 2025-06-12
Test Environment:
- Model:
gpt-4o-mini - Cloud Provider: Arvancloud
- Location: Middle East
ME Performance Results (Historical)
| Metric | AvalAI (gpt-4o-mini) | OpenAI (gpt-4o-mini) |
|---|---|---|
| Average TTFB (s) | 0.993 | 1.095 |
| Median TTFB (s) | 0.929 | 0.951 |
| 95th Percentile TTFB (s) | 1.479 | 1.386 |
| Avg Tokens per Second | 11.4 | 9.6 |
| Success Rate | 100.00% | 100.00% |
Historical Analysis
Even in June 2025, AvalAI provided competitive performance for Middle East users with lower latency and higher throughput than direct OpenAI access. Our October results show significant further improvements from our optimization efforts.
Reproduce the regional latency results
We believe in full transparency. You can use the Python script below to run these performance tests yourself and verify our results.
Note: While these benchmarks were conducted using the gpt-4o-mini model, the performance improvements apply to all models available on our platform. You are encouraged to test any model of your choice using this script to see how AvalAI performs for your specific use case.
Please ensure you have the necessary libraries installed (requests, numpy, matplotlib, seaborn, tabulate, tqdm).
import os
import requests
import time
import numpy as np
import matplotlib.pyplot as plt
import json
from tabulate import tabulate
from tqdm import tqdm
from datetime import datetime
import seaborn as sns


def test_api_performance(
    api_name, api_url, api_key, model, num_requests=10, prompt="Say hi"
):
    """Test API performance and collect comprehensive metrics"""
    headers = {"Content-Type": "application/json", "Authorization": f"Bearer {api_key}"}
    data = {"model": model, "messages": [{"role": "user", "content": prompt}]}

    ttfb_times = []
    total_times = []
    token_counts = []
    tokens_per_second = []
    errors = 0

    print(f"Testing {api_name} API with {num_requests} requests...")
    for _ in tqdm(range(num_requests)):
        try:
            start_time = time.time()
            response = requests.post(
                api_url, headers=headers, json=data, timeout=(10, 30)
            )
            response_time = time.time()

            # Process the response
            response_json = response.json()
            end_time = time.time()

            # Calculate metrics
            ttfb = response_time - start_time
            total_time = end_time - start_time

            # Try to get token count if available
            try:
                usage = response_json.get("usage", {})
                total_tokens = usage.get("total_tokens", 0)
                completion_tokens = usage.get("completion_tokens", 0)
                token_counts.append(total_tokens)

                # Calculate tokens per second (using completion tokens)
                if completion_tokens > 0 and total_time > 0:
                    tokens_per_second.append(completion_tokens / total_time)
                else:
                    tokens_per_second.append(0)
            except Exception as e:
                token_counts.append(0)
                tokens_per_second.append(0)

            ttfb_times.append(ttfb)
            total_times.append(total_time)

            # Add a small delay to avoid rate limiting
            time.sleep(0.5)

        except Exception as e:
            print(f"Error on request: {e}")
            errors += 1

    return {
        "name": api_name,
        "url": api_url,
        "model": model,
        "average_ttfb": np.mean(ttfb_times) if ttfb_times else None,
        "median_ttfb": np.median(ttfb_times) if ttfb_times else None,
        "p95_ttfb": np.percentile(ttfb_times, 95) if ttfb_times else None,
        "average_total": np.mean(total_times) if total_times else None,
        "median_total": np.median(total_times) if total_times else None,
        "p95_total": np.percentile(total_times, 95) if total_times else None,
        "ttfb_times": ttfb_times,
        "total_times": total_times,
        "token_counts": token_counts,
        "avg_tokens": (
            np.mean(token_counts) if token_counts and any(token_counts) else None
        ),
        "tokens_per_second": tokens_per_second,
        "avg_tokens_per_second": (
            np.mean([t for t in tokens_per_second if t > 0])
            if tokens_per_second and any(tokens_per_second)
            else None
        ),
        "median_tokens_per_second": (
            np.median([t for t in tokens_per_second if t > 0])
            if tokens_per_second and any(tokens_per_second)
            else None
        ),
        "success_rate": (
            len(ttfb_times) / (len(ttfb_times) + errors)
            if (len(ttfb_times) + errors) > 0
            else 0
        ),
        "error_count": errors,
    }


def print_comparison_table(results_avalai, results_openai):
    """Print comparison table between two APIs"""
    headers = [
        "Metric",
        f"AvalAI ({results_avalai['model']})",
        f"OpenAI ({results_openai['model']})",
    ]

    data = [
        [
            "Average TTFB (s)",
            f"{results_avalai['average_ttfb']:.3f}",
            f"{results_openai['average_ttfb']:.3f}",
        ],
        [
            "Median TTFB (s)",
            f"{results_avalai['median_ttfb']:.3f}",
            f"{results_openai['median_ttfb']:.3f}",
        ],
        [
            "95th Percentile TTFB (s)",
            f"{results_avalai['p95_ttfb']:.3f}",
            f"{results_openai['p95_ttfb']:.3f}",
        ],
        [
            "Average Total Time (s)",
            f"{results_avalai['average_total']:.3f}",
            f"{results_openai['average_total']:.3f}",
        ],
        [
            "Median Total Time (s)",
            f"{results_avalai['median_total']:.3f}",
            f"{results_openai['median_total']:.3f}",
        ],
        [
            "95th Percentile Total (s)",
            f"{results_avalai['p95_total']:.3f}",
            f"{results_openai['p95_total']:.3f}",
        ],
        [
            "Success Rate",
            f"{results_avalai['success_rate']:.2%}",
            f"{results_openai['success_rate']:.2%}",
        ],
    ]

    # Add token metrics if available
    if (
        results_avalai["avg_tokens"] is not None
        and results_openai["avg_tokens"] is not None
    ):
        data.append(
            [
                "Avg Tokens per Response",
                f"{results_avalai['avg_tokens']:.1f}",
                f"{results_openai['avg_tokens']:.1f}",
            ]
        )

    # Add tokens per second metrics if available
    if (
        results_avalai["avg_tokens_per_second"] is not None
        and results_openai["avg_tokens_per_second"] is not None
    ):
        data.append(
            [
                "Avg Tokens per Second",
                f"{results_avalai['avg_tokens_per_second']:.1f}",
                f"{results_openai['avg_tokens_per_second']:.1f}",
            ]
        )
        data.append(
            [
                "Median Tokens per Second",
                f"{results_avalai['median_tokens_per_second']:.1f}",
                f"{results_openai['median_tokens_per_second']:.1f}",
            ]
        )

    print("\nAPI Performance Comparison:")
    print(tabulate(data, headers=headers, tablefmt="grid"))


def plot_comparison(results_avalai, results_openai, output_file=None):
    """Create improved visualization plots for API comparison"""
    # Set the style
    sns.set(style="whitegrid")

    # Create figure with subplots - adding a third subplot for tokens per second
    fig, axes = plt.subplots(3, 1, figsize=(12, 15))

    # Define metrics to plot
    metrics = [
        ("ttfb_times", "Time to First Byte (s)"),
        ("total_times", "Total Request Time (s)"),
        ("tokens_per_second", "Tokens per Second"),
    ]

    # Define colors for each API
    colors = {"AvalAI": "#3498db", "OpenAI": "#2ecc71"}

    for i, (metric, title) in enumerate(metrics):
        # Create violin plots with individual points
        ax = axes[i]

        # Prepare data for plotting
        data_to_plot = []
        labels = []

        for result, label in [(results_avalai, "AvalAI"), (results_openai, "OpenAI")]:
            # Filter out zeros for tokens per second
            if metric == "tokens_per_second":
                data_to_plot.append([t for t in result[metric] if t > 0])
            else:
                data_to_plot.append(result[metric])
            labels.append(f"{label}\n({result['model']})")

        # Create violin plot
        parts = ax.violinplot(data_to_plot, showmeans=True, showmedians=True)

        # Customize violin plots
        for pc, color_key in zip(parts["bodies"], colors.keys()):
            pc.set_facecolor(colors[color_key])
            pc.set_alpha(0.7)

        # Add boxplot inside violin
        bp = ax.boxplot(
            data_to_plot,
            positions=range(1, len(data_to_plot) + 1),
            widths=0.15,
            patch_artist=True,
            showfliers=False,
        )

        # Customize boxplots
        for box, color_key in zip(bp["boxes"], colors.keys()):
            box.set(color="black", linewidth=1.5)
            box.set(facecolor="white")

        # Add scatter points with jitter
        for j, data in enumerate(
            [
                (
                    results_avalai[metric]
                    if metric != "tokens_per_second"
                    else [t for t in results_avalai[metric] if t > 0]
                ),
                (
                    results_openai[metric]
                    if metric != "tokens_per_second"
                    else [t for t in results_openai[metric] if t > 0]
                ),
            ]
        ):
            # Add jitter to x position
            x = np.random.normal(j + 1, 0.05, size=len(data))
            ax.scatter(
                x,
                data,
                alpha=0.4,
                s=20,
                color=list(colors.values())[j],
                edgecolor="white",
                linewidth=0.5,
            )

        # Set labels and title
        ax.set_title(title, fontsize=14, fontweight="bold")
        if metric == "tokens_per_second":
            ax.set_ylabel("Tokens/second", fontsize=12)
        else:
            ax.set_ylabel("Time (seconds)", fontsize=12)
        ax.set_xticks(range(1, len(labels) + 1))
        ax.set_xticklabels(labels, fontsize=12)

        # Add horizontal grid lines
        ax.yaxis.grid(True, linestyle="--", alpha=0.7)

        # Add stats as text
        for j, (result, label) in enumerate(
            [(results_avalai, "AvalAI"), (results_openai, "OpenAI")]
        ):
            if metric == "tokens_per_second":
                if result["avg_tokens_per_second"] is not None:
                    stats = (
                        f"Mean: {result['avg_tokens_per_second']:.1f}\n"
                        f"Median: {result['median_tokens_per_second']:.1f}"
                    )
                    max_val = (
                        max([t for t in result[metric] if t > 0])
                        if any(t > 0 for t in result[metric])
                        else 0
                    )
                    ax.annotate(
                        stats,
                        xy=(j + 1, max_val * 1.05),
                        ha="center",
                        va="bottom",
                        fontsize=10,
                        bbox=dict(boxstyle="round,pad=0.5", fc="white", alpha=0.7),
                    )
            else:
                stats = (
                    f"Mean: {result[f'average_{metric.split("_")[0]}']:.3f}s\n"
                    f"Median: {result[f'median_{metric.split("_")[0]}']:.3f}s\n"
                    f"95th: {result[f'p95_{metric.split("_")[0]}']:.3f}s"
                )
                ax.annotate(
                    stats,
                    xy=(j + 1, result[f'p95_{metric.split("_")[0]}'] * 1.05),
                    ha="center",
                    va="bottom",
                    fontsize=10,
                    bbox=dict(boxstyle="round,pad=0.5", fc="white", alpha=0.7),
                )

    # Add title and timestamp
    plt.suptitle(
        f"API Performance Comparison: AvalAI vs OpenAI", fontsize=16, fontweight="bold"
    )
    plt.figtext(
        0.5,
        0.01,
        f'Generated on {datetime.now().strftime("%Y-%m-%d %H:%M:%S")}',
        ha="center",
        fontsize=10,
    )

    plt.tight_layout(rect=[0, 0.03, 1, 0.97])

    if output_file:
        plt.savefig(output_file, dpi=300, bbox_inches="tight")
        print(f"Plot saved to {output_file}")
    else:
        plt.show()


def save_results(results_avalai, results_openai, filename):
    """Save results to JSON file"""
    # Convert numpy arrays to lists for JSON serialization
    results_avalai_copy = results_avalai.copy()
    results_openai_copy = results_openai.copy()

    for key in ["ttfb_times", "total_times", "token_counts"]:
        if key in results_avalai_copy:
            results_avalai_copy[key] = [float(x) for x in results_avalai_copy[key]]
        if key in results_openai_copy:
            results_openai_copy[key] = [float(x) for x in results_openai_copy[key]]

    data = {
        "timestamp": time.strftime("%Y-%m-%d %H:%M:%S"),
        "results": {"avalai": results_avalai_copy, "openai": results_openai_copy},
    }

    with open(filename, "w") as f:
        json.dump(data, f, indent=2)

    print(f"Results saved to {filename}")


def main():
    # API configuration
    model_name = "gpt-4o-mini"

    url_avalai = "https://api.avalai.ir/v1/chat/completions"
    api_key_avalai = os.getenv("AVALAI_API_KEY")  # Replace with actual key

    url_openai = "https://api.openai.com/v1/chat/completions"
    api_key_openai = os.getenv("OPENAI_API_KEY")  # Replace with actual key

    # Number of requests to make for each API
    num_requests = 60

    # Test prompt
    prompt = "Say hi"

    # Run the tests
    results_avalai = test_api_performance(
        "AvalAI", url_avalai, api_key_avalai, model_name, num_requests, prompt
    )
    results_openai = test_api_performance(
        "OpenAI", url_openai, api_key_openai, model_name, num_requests, prompt
    )

    # Print comparison table
    print_comparison_table(results_avalai, results_openai)

    # Generate visualization
    plot_comparison(results_avalai, results_openai, "api_performance_comparison.png")

    # Save results
    save_results(results_avalai, results_openai, "api_performance_results.json")


if __name__ == "__main__":
    main()